Windows Process Internals: A few Concepts to know before jumping on Memory Forensics [Part 3] – Journey in to the PsLoadedModuleList ( Loaded Kernel Modules)
This is the Part-3 of the series of article “Windows Process Internals: A few Concepts to know before jumping on Memory Forensics”. In Part-1, we saw that how _EPROCESS stores the information about the active processes on the system and how we can traverse through all the processes using live kernel debugger. Volatility Plugins like pslist and pstree use _EPROCESS memory structures to fetch the information about the active processes on the system. In Part-2, we saw that how _PEB stores information about the loaded modules (dlls) and how to traverse through various lists that stores information about the loaded modules. Volatility Plugin like dlllist and ldrmodules use _PEB memory structures of the process to fetch the information about the loaded dlls.
In this part-3, we will see how memory stores the information about the loaded modules (kernel drivers) and how to traverse through the list of the loaded modules/drivers to fetch all the loaded drivers on the system.
To track the loaded kernel modules on the system, the first thing we need to get hold of is PsLoadedModuleList which is one of the fields of KDBG (Kernel Debugger). PsLoadedModuleList points to the doubly linked list. This doubly LinkedList points to the KLDR_DATA_TABLE_ENTRY structures that holds the metadata/information about the loaded kernel modules. The first and last node of the LinkedList points back to the PsLoadedModuleList. Please look at the following diagram to get a better understanding of the verbiage above.
Volatility plugin “modules” and any other tool that uses Windows API will traverse through this doubly LinkedList and fetch the information about the loaded kernel modules. This list arranges its nodes based on the order of module loading in to the memory. Hence, typically first 2 entries of the list would be ntoskrnl.exe and hal.dll (as shown in the diagram).
Now, let us use, kernel debugger and go through this doubly linked list.
First step is to identify the PsLoadedModuleList pointer.
Now, we have a pointer to the head of the doubly LinkedList ( _LIST_ENTRY structure) that points to the module metadata structure (_KLDR_DATA_TABLE_ENTRY). Let us enumerate the _LIST_ENTRY to see where it is pointing to.
We have got our head of the list which is seating at 0xffffdb84`c4679570. The structure at this pointer is KLDR_DATA_ENTRY_TABLE. Let us enumerate it and see which is this module.
As expected, it is ntoskrnl.exe. Please note that it shows the fullpath on the disk for the loaded module.
Let us look at the next entry (should be hal.dll) in the list. To get to the hal.dll metadata structure, we need to look at the FLINK of InLoadOrderLinks field in the first metadata entry (for ntoskrnl.exe).
As expected, it is a structure for hal.dll.
Finally, let us traverse through the entire list to fetch the all loaded kernel modules in the memory. We can pickup any reference pointer and traverse from there, we will pick up the pointer to hal.dll and traverse from there – ntoskrnl.exe should be listed last in the output. Let us see.
As you can see, we started from hal.dll and ended up at the ntoskrnl.exe and listed down all the loaded modules by traversing through the doubly LinkedList pointed by PsLoadedModuleList.
That’s it for now, folks !! happy hunting, fellas!!
In this video from our Android Malware Analysis course by Tom Sermpinis you can see how Android malware analysis is done in a few simple steps - the demonstration includes the most important tools to use. If you're just looking into this topic, this is a great start!
One of the bigger threats in the recent years of Android’s existence is malware, and in this course we are going to examine the existing Android malware, learn how they work, straight from the source and what harm they can cause. In this course we will get introduced to the basics of Malware development and analysis.
What will you learn about?
Android malware functions & properties
Android malware most common examples
In depth examination and analysis of the most lethal and famous Android malware
Android malicious code characteristics
Mobile malware development principles
What skills will you gain?
Android malicious application analysis
Android malware analysis
Using Android app analysis tools
Static and dynamic analysis
Android ecosystem exploitation through existing malware
What will you need?
PC with a preferred operating system (Mac OSX 10.5+, Windows 7+, Linux)
Android Device
What should you know before you join?
Basics of Android Ecosystem
Basics of Java and Programming in general
Basics of XML
Course format:
The course is self-paced – you can visit the training whenever you want and your content will be there.
Once you’re in, you keep access forever, even when you finish the course.
There are no deadlines, except for the ones you set for yourself.
We designed the course so that a diligent student will need about 18 hours of work to complete the training.
Tools you will use:
ApkTool
Zipalign tool
Dex2jar
JD-GUI
APKInspector
Dexter
Metsaploit
Your instructor: Tom Sermpinis
4 years of experience in Android ecosystem
7 years of experience in Penetration Testing
Java, C++, Python
Editor of “Penetration Testing with Android Devices” and “Penetration Testing with Kali 2.0” courses of PenTest Magazine.
Windows Process Internals: A few Concepts to know before jumping on Memory Forensics [Part 4] — Journey in to the Undocumented VAD Structures (Virtual Address Descriptors)
What is Virtual Address Descriptor (VAD)?
For each process, memory manager maintains a set of Virtual Address Descriptors (VADs) that describes the ranges of virtual memory address space reserved for that specific process. It also stores information about allocation type (private/shared), memory protection (read/write/execute etc.) and inheritance. VAD is a tree structure and like any tree structure it has a root (which is called Vadroot) and nodes/leafs (Vadnodes) that contains all the information related to memory ranges reserved for a specific process by the memory manager. For each chunk of a continuous virtual memory address allocations, memory manager creates a corresponding VAD node that contains the information about this continuous allocations and other information as mentioned above.
If any file is mapped in any of these memory regions, VAD node contains the full-path information for that file. This is really important information from the memory forensics perspective. If any dll or exe is mapped in one of these memory ranges then the VAD node (which is a Kernel structure) contains the full path on disk for that dll/exe. This information helps us in identifying any malicious activities like unlinking dll in the standard _PEB ldrmodules. The information is still available even if dll is unlinked from all 3 ldrmodules in _PEB (which is a user mode structure).
VAD information can be used in revealing many attacks like dll injection, reflective code injection etc. We will not talk about those attacks and how to identify them in this article as plenty of material available on the Internet for the same.
In this article, we will talk about the kernel data structures related to VAD in Win10. VAD structures have been undergone multiple changes during Windows transition from WinXP to Win10. We will talk about Win10 (build 18362.1016). There is not much information available about these structures available on the Internet. Many of VAD kernel structures are not documented properly.
Let us go through methodically and dig out the information about the mapped fie in a particular VADnode.
Which Volatility Plugins provide Information about VAD?
Vadinfo,vadtree and vaddump – we will not talk about these plugins here but we will talk about the kernel structures form which they fetch the information. I would like to show here the visual output from the vadtree plugin – that is visually appealing and provides visual cues for quick analysis. We will talk about how to interpret this output in some other article.
Let us Explore Kernel Memory Structures related to VAD
First of all, let us get hold of Vadroot. As mentioned above, each process has its vadtree, let us enumerate the process and pick any of the process randomly. Once we identify the process, we need to enumerate _EPROCESS to get the address of the Vadroot as Vadroot is one of the fields of _EPROCESS structure.
Let’s say, I have identified a random process and its _EPROCESS is at the memory address location ffffaf0f07a7e080. Let us enumerate the _EPROCESS and grep Vadroot.
You can see that Vadroot is a _RTL_AVL_TREE structure and there is a pointer to the first node 0xffffaf0f`07ab3c30 of the tree. Now, as shown in the figure, the data structure at 0xffffaf0f`07ab3c30 is of RTL_BALANCED_NODE. If we enumerate that we will get the information about the its children and other related information to that node.
You can see here that there are fields like Children, Left and Right. There are 2 children of this node and there is a pointer to each child. One child would be in the left of this node and one child would be in right of this node based on its memory locations. If we further enumerates the Children we get the same information as Left and Right fields.
Each node has a its Tag value which comes before the actual structure starts in the memory location. The tag of the node will let you understand what kind of Information is stored in the memory ranges of that node.
Secondly, _RTL_BALANCED_NODE is alias for _MMVAD and _MMVAD_Short. These are the actual structures that we need to enumerate.
VAD Tags
Let us enumerate the Tag for the first node and see what Tag it contains. Tag information is contained 12bytes before the actual node structure starts. So, we need to look at the 12 bytes before the structure. So, our first node is at 0xffffaf0f`07ab3c30.
Memory Mapped Files
You can see the Tag “Vad” which indicates that this node is of _MMVAD structure. So, let us enumerate this node to get the specific information about the name of the file that has been mapped in a specific section.
We need to focus on the fields “subsection” as this field contains the information about the mapped file in that region of the virtual memory. Let us enumerate it.
Focus on ControlArea here and enumerate it. You will get a FilePointer in this field.
Now, the trickiest part comes now. This file pointer is not a straight forward pointer the _FILE_OBJECT. It is a _EX_FAST_REF structure and we need to do some jugglery to get the file object pointer from it. I would like to thank to the @ McDermott Cybersecurity, LLC’s blog. Without referring to this blog, it would have been impossible to get to the correct file pointer. Now, here is the magic. We need to replace the last bit of the FilePointer field in the previous output to 0(Zero) and that would be our pointer to the _FILE_OBJECT. So, we have a filepointer at 0xffffaf0f`078d237b.
Replacing last bit of this address with zero will give us 0xffffaf0f`078d2370. Enumerate file_object at this pointer.
You can see that we have got the file name here. It shows that everything.exe is mapped in the ranges described by this node and the full path to the binary is “\Program Files\Everything\Everything.exe”.
VAD Flags
We can talk about the Flags as well. There are multiple Flags associated with every node. However, we will talk about only memory protection flag as it is one of the important flags for any node.
Value
Protection Type
0
MM_ZERO_ACCESS
1
MM_READONLY
2
MM_EXECUTE
3
MM_EXECUTE_READ
4
MM_READWRITE
5
MM_WRITECOPY
6
MM_EXECUTE_READWRITE
7
MM_EXECUTE_WRITECOPY
Please refer above table to understand the Protection type corresponding to the Protection Flags Value. Let us examine, protection flag value for the node.
The value of the Protection flag is 0x7 which means the protection is EXECUTE_WRITECOPY. This is the typical memory protection used for the memory ranges where exe/dll (binary) files are mapped.
Value
VadType
0
VadNone
1
VadDevicePhysicalMemory
2
VadImageMap
3
VadAwe
4
VadWriteWatch
5
VadLargePages
6
VadRotatePhysical
If you have observed “VadType” the previous output then it is 2 which is equivalent to VadImageMap. That means that there is an image mapped in the regions of the Vadnode.
There are many things to explore in each and every vad kernel structures. We have covered here a few important structures and associated key fields.
That’s it for now, folks!! Happy hunting, fellas!!
Setting Up Restricted Internet Connection for iPhone Extraction
Regular or disposable Apple IDs can now be used to extract data from compatible iOS devices if you have a Mac. The use of a non-developer Apple ID carries certain risks and restrictions. In particular, one must “verify” the extraction agent on the target iPhone, which requires an active Internet connection. Learn how to verify the extraction agent signed with a regular or disposable Apple ID without the risk of receiving an accidental remote lock or remote erase command.
What’s this all about
Elcomsoft iOS Forensic Toolkit utilizes a special technique for extracting the file system and decrypting the keychain from iOS devices without a jailbreak. This technique uses an in-house app that serves as an extraction agent. While agent-based acquisition provides numerous benefits over jailbreak-based acquisition, it requires the use of an Apple account to sign the extraction agent. Using a regular (non-developer) Apple ID to sideload the agent requires the expert to “trust” the signing certificate by “verifying” the extraction app. This, in turn, requires allowing the device to connect to an Apple server.
Allowing the device being investigated connecting to the internet is risky due to potential sync issues and the probability of receiving a remove lock or remote wipe command from the Find My iPhone service. Mitigating this risk is possible by restricting on-device connectivity to a single subdomain of apple.com that is required to verify the signing certificate.
Mitigating the risks
The easiest way to avoid the risks is eliminating the need for the iPhone to check the signing certificate. If the extraction agent is signed with an Apple ID enrolled in Apple’s Developer Program, the iPhone may remain offline when you sideload the extraction agent.
The troubles arise when you don’t have a Developer Account to hand, and still need to fulfil a device extraction. Note that you can only use a non-developer Apple ID to sign the extraction agent if you are using a Mac. Windows users must use an Apple ID enrolled in the Developer Program as there is no workaround available for that platform.
To reduce the risks of exposing the iPhone device being remotely tampered with, we’ll need to restrict it’s online connectivity. Ideally, the iPhone should be only able to connect to a single certificate validation server – with all other communications being terminated.
Apple Certificate Validation Server: ppq.apple.com (17.173.66.213), port 443.
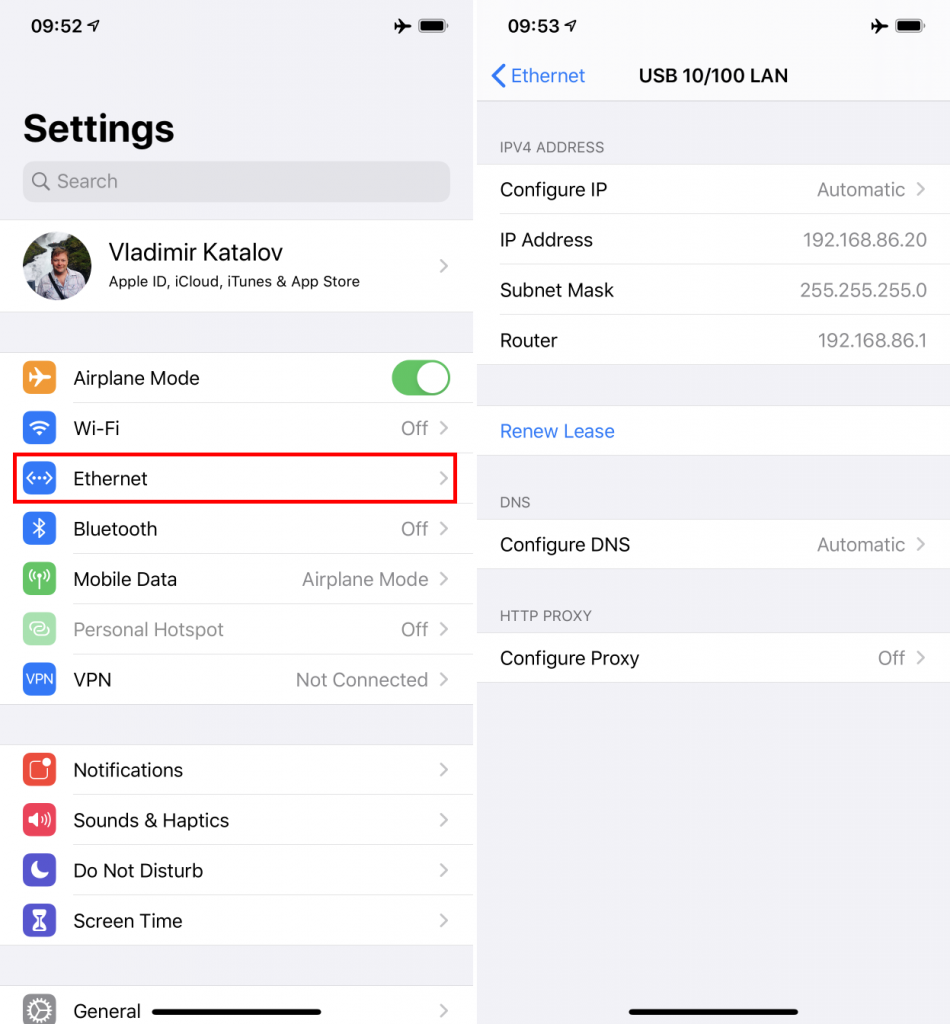
There are several ways one can achieve the goal. For some, the easier method would be configuring a dedicated Wi-Fi network and setting up a router whitelist. Others will prefer to leave the device’s radios disabled, using a pre-configured wired connection instead (with Lightning to Ethernet adapter like this one, or a cheaper alternative, or a combination of the Lightning to USB Adapter and the USB Ethernet Adapter).
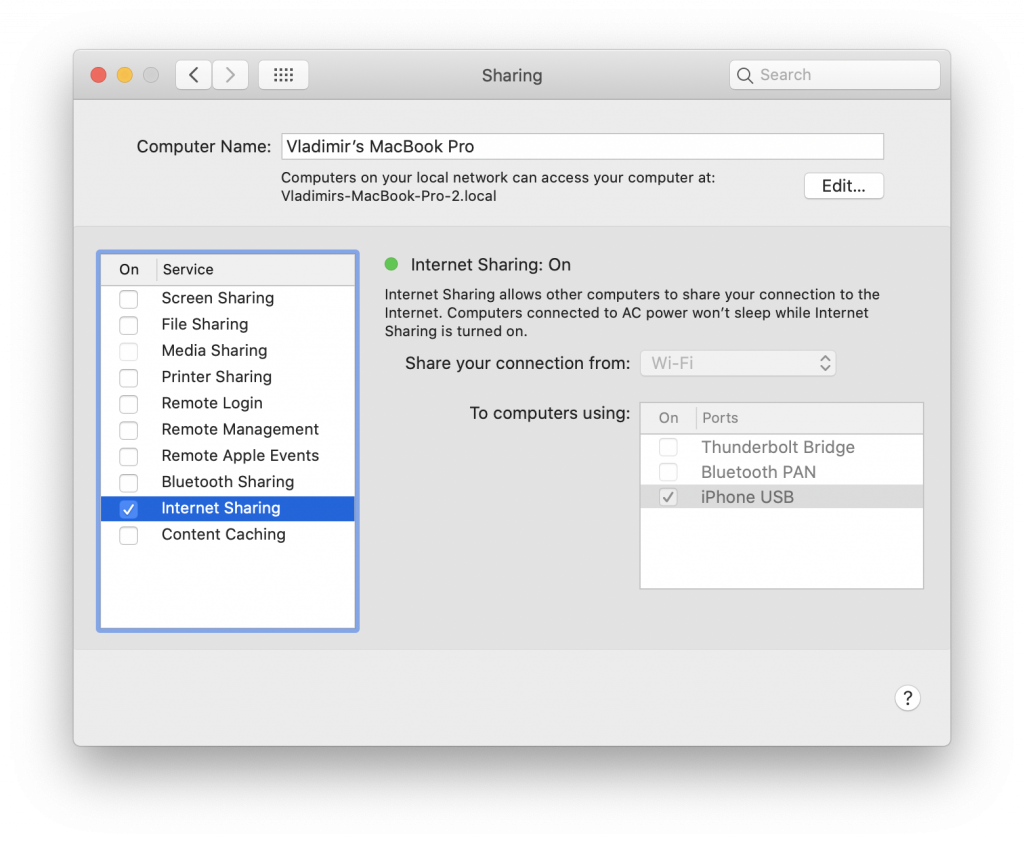
However, once you have a Mac, there is no requirement for any extra hardware, and you’ll be able to share the Internet connection from it to the iPhone, limiting access an easier way.
Step 1. Connect any iPhone (jut not the one being extracted!) to the Mac. Open [Settings] | [Shared] and make sure that Internet Sharing in “To computers using:” contains the “iPhone USB” item.
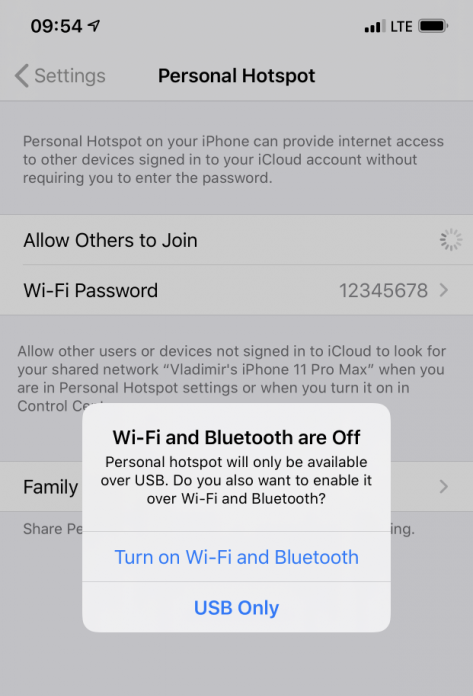
If there is no such item, temporarily enable Personal Hotspot (USB only). The item should appear. After that, you can disconnect the iPhone and disable the personal hotspot.
Step 2. Make sure that no iPhone is connected to the Mac, and activate firewall (for this specific interface only, i.e. iPhone USB), allowing access to ppq.apple.com only. That can be easily done by running our script as a root user, e.g.:
sudo ./install_firewall.sh
The content of the script is quite simple:
#!/bin/bash
cp /etc/pf.conf /etc/pf.conf.backup
echo "table <allowed-hosts> { ppq.apple.com, 192.168.2.0/24 }" >> /etc/pf.conf
echo "block drop in quick on bridge100 proto tcp from any to !<allowed-hosts>" >> /etc/pf.conf
pfctl -f /etc/pf.conf
Step 3. Connect the iPhone being investigated. The agent should be already installed (if it not installed yet, you can do it at this point), and enable Internet Sharing to iPhone USB.
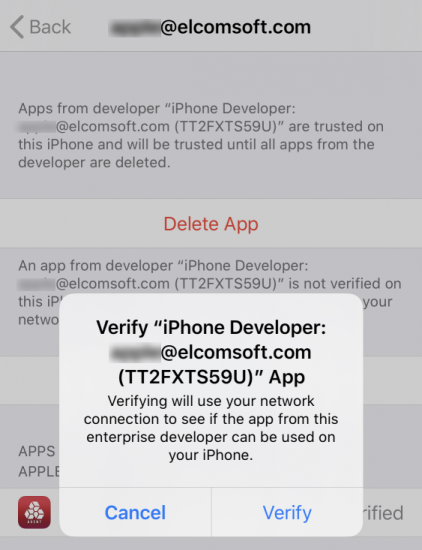
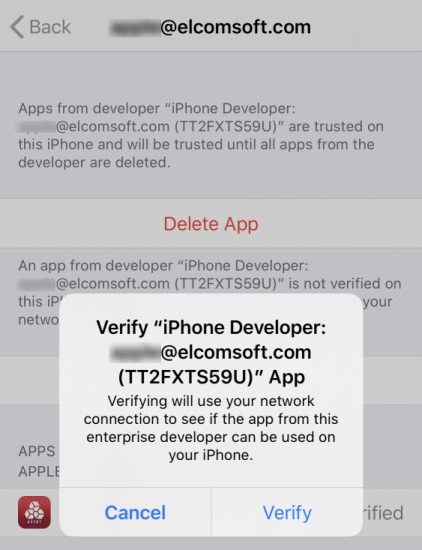
Step 4. Approve/verify the certificate (issued to the Apple ID you used for sideloading the agent).
Step 5. Do the extraction with EIFT.
Step 6. You can uninstall the firewall now (and restore the original configuration, as it has been backed up at the second step) by running the second script, again as a root user:
You can also keep the current setup for further extractions (if you ever need to install the agent onto other iPhones). From now on, any iPhone connected to this Mac (after the firewall setup) will only have access to the particular Apple server required for certificate approval; it will not sync (neither the system nor any applications) or have access to any remote lock/wipe commands.
Extracting iPhone File System and Keychain Without an Apple Developer Account
Last year, we have developed an innovative way to extract iPhone data without a jailbreak. The method’s numerous advantages were outweighed with a major drawback: an Apple ID enrolled in the paid Apple’s Developer program was required to sign the extraction binary. This is no longer an issue on Mac computers with the improved sideloading technique.
What’s this all about
When extracting an iOS device (pulling the file system and decrypting the keychain), one needs low-level access to the device. Traditionally, we’ve been using public jailbreaks for privilege escalation, yet recently we switched to a new method that does not require a jailbreak. Jailbreak-free extraction utilizes an Elcomsoft-developed extraction agent. Agent-based extraction provides tangible benefits over the traditional extraction method based on jailbreaking the device, being a safer, faster, and more robust alternative. Until today, agent-based extraction had a major drawback: in order to have the extraction binary signed, it required an Apple account registered in the Apple Developer program. We’ve circumvented this restriction in the latest release of iOS Forensic Toolkit for Mac. Users of the Windows edition still need the Developer account to perform the extraction.
A bit of history
Apple has a tight grip on the iOS ecosystem. In Apple dreams, everyone must pay for accessing the app ecosystem. Developers must purchase Apple hardware and Apple development tools; they must also purchase membership in the paid Apple Developer program. There is a separate recurring fee for publishing apps in the App Store, but even that fee does not guarantee the acceptance.
Users who wanted to install a non-approved app from a channel other than the official App Store had several choices. They could jailbreak the device and use one of the alternative app stores. They could pay Apple for the privilege by registering as a Developer. Finally, they could install a limited number of apps to their device and keep them for as long as 7 days without paying a dime. This process is called “sideloading”, and this is the same process that was used by forensic experts to install extraction software for imaging devices.
Historically, iOS users and forensic experts had been able to sideload third-party apps by using an ordinary, often throwaway Apple ID for signing the binaries. Cydia Impactor is a free tool often used for the purpose, but alternatives also exist. In November 2019, Apple made an abrupt change to their provisioning service, effectively blocking the sideloading mechanism for all but the users of a paid Apple Developer accounts. Saurik, the developer of Cydia Impactor, twitted about the issue. Since then, nothing but a paid Apple Developer account could be used to sign the binaries. Officially, this is still the case today. Unofficially, around the same time last year many users started having problems registering a personal Apple Developer account.
Developer or throwaway Apple ID for iPhone extraction?
A subscription to become a registered developer is affordable; it’s a tiny fraction of the cost of tools one needs to extract the iPhone. Using a developer account for sideloading the extraction software has tangible benefits over using a regular or anonymous (throwaway) Apple ID. We created a blog article explaining the benefits of the developer account compared to a throwaway Apple ID for the purpose of iOS extraction. In a word, utilizing an Apple account registered in the Developer program allows signing and sideloading apps, and bypassing the on-device certificate verification, which would otherwise require an Internet connection on the device with all the risks of exposing the device to remote lock/erase.
However, a large number of experts working for the law enforcement were and remain hesitant to obtain such accounts for various non-financial reasons. Registering for a personal Developer Account with Apple had become particularly challenging in the recent months, with Apple rejecting numerous applications with no explanation and no resolution through their support service. If you are seeing the “Your enrollment could not be completed” message, check out this thread for suggestions.
As a result, we’ve felt the urge to develop a working solution allowing experts to use regular or anonymous (throwaway) Apple IDs for signing the extraction software and performing the imaging.
Our work
We have discovered a way to enable the use of regular and disposable Apple ID’s for the purpose of agent-based data extraction. All you need is the latest build of iOS Forensic Toolkit, a Mac computer, and a cable to connect the iPhone to the Mac. In this guide, we’ll demonstrate how to image an iOS device with a disposable Apple ID.
Compatibility, pre-requisites and restrictions
In order to launch the attack, you will need all of the following.
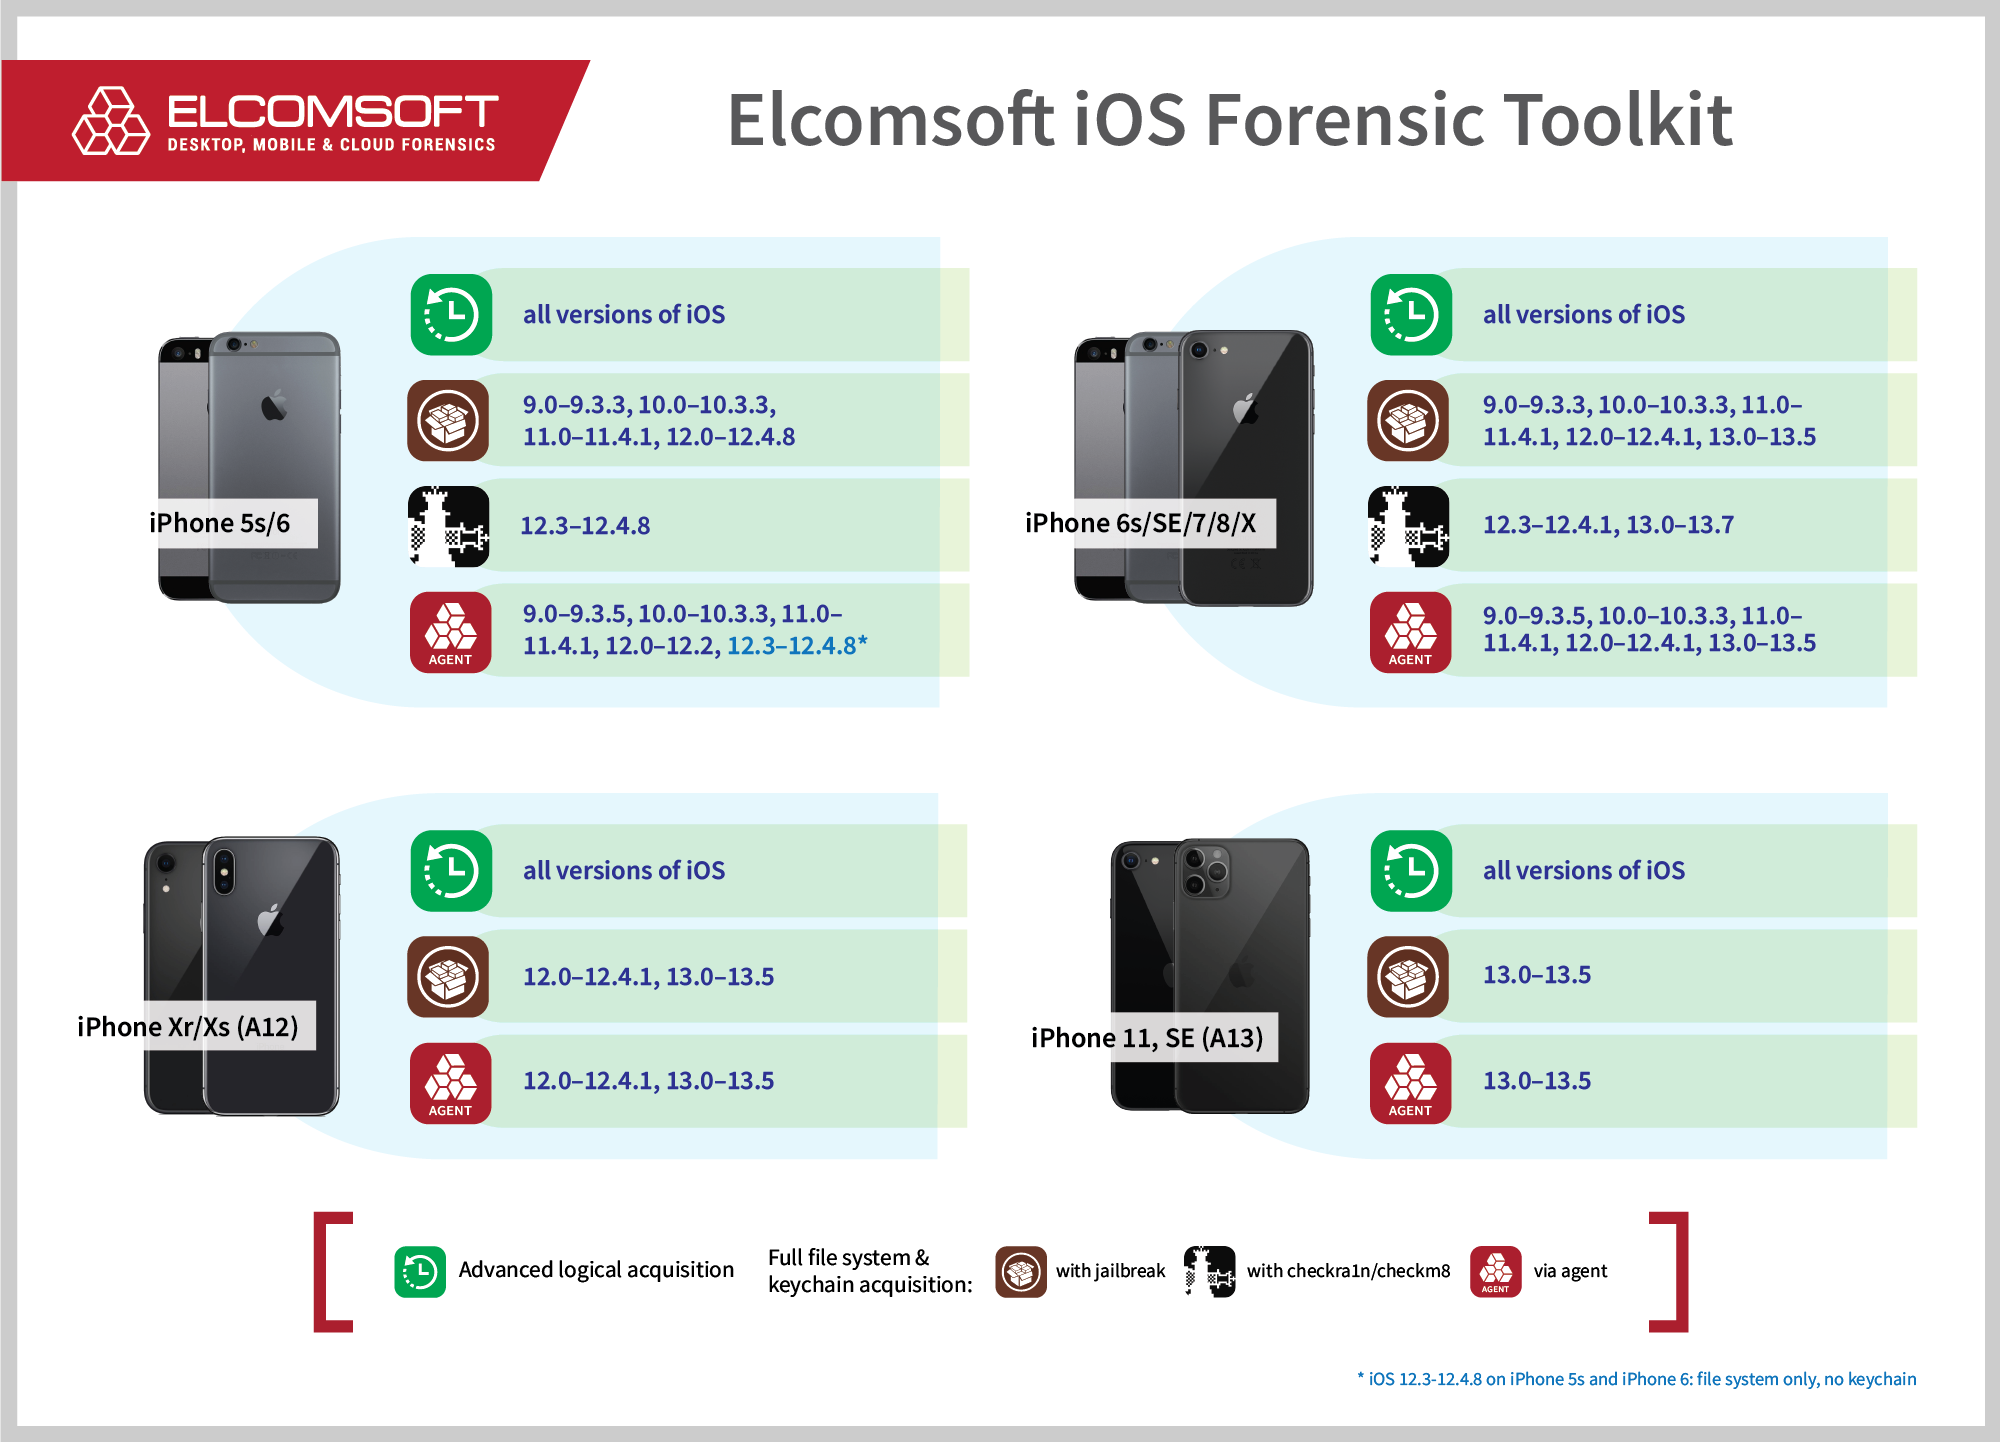
A compatible iPhone model running a supported version of iOS. The list of supported devices is available below. At this time, agent-based extraction is supported for all models ranging from the iPhone 5s through 11 Pro Max with iOS 9.0 through 13.5.
A desktop or laptop computer with macOS 10.12 (Sierra) through 10.15 (Catalina).
A Lightning cable.
Apple ID (personal or disposable) with or without two-factor authentication.
Compared to using a Developer account, signing the extraction agent with a regular or throwaway Apple ID has the following restrictions.
The signing certificate is only valid for 7 days. This is normally not an issue as extractions should performed on the same day as sideloading the agent.
A non-developer Apple ID can be only used to sign a handful of devices (it was 3 devices when we last checked). This is why many experts prefer creating throwaway Apple IDs for device extractions.
You will need to pass two-factor authentication when signing in. The 2FA code will be pushed onto a trusted device (no SMS delivery), so you’ll need to have one ready. Note that you will not be prompted for the code if the Mac is already trusted (e.g. it is tied to the Apple ID you are about to use). We have not tested the tool with non-2FA accounts.
You will need to approve (Trust) the signing certificate on the iOS device. This is only possible when the device is connected to the Internet, so you’ll have to break the “Airplane mode only” rule to avoid the possible remote lock or erase command.
Steps to extract
Important: if you are performing a forensic extraction (as opposed to extracting your own iPhone), set up a restricted Internet connection first, as described in the following article: Setting Up Restricted Internet Connection.
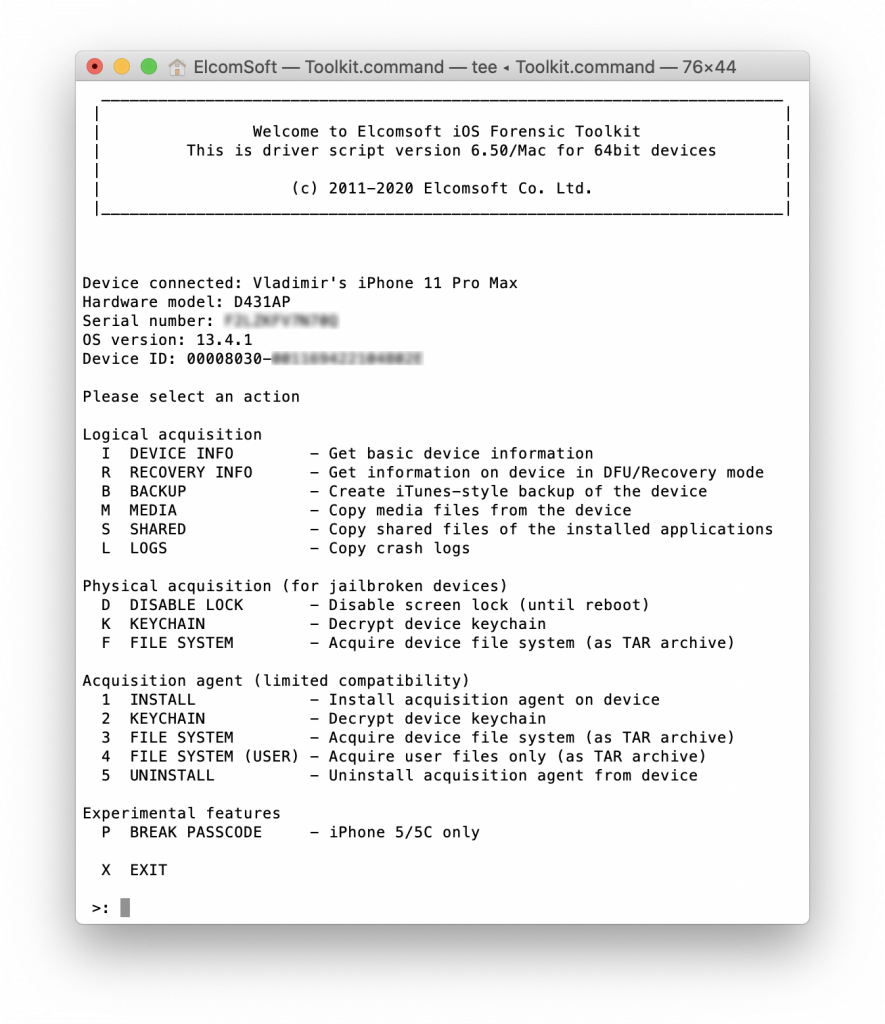
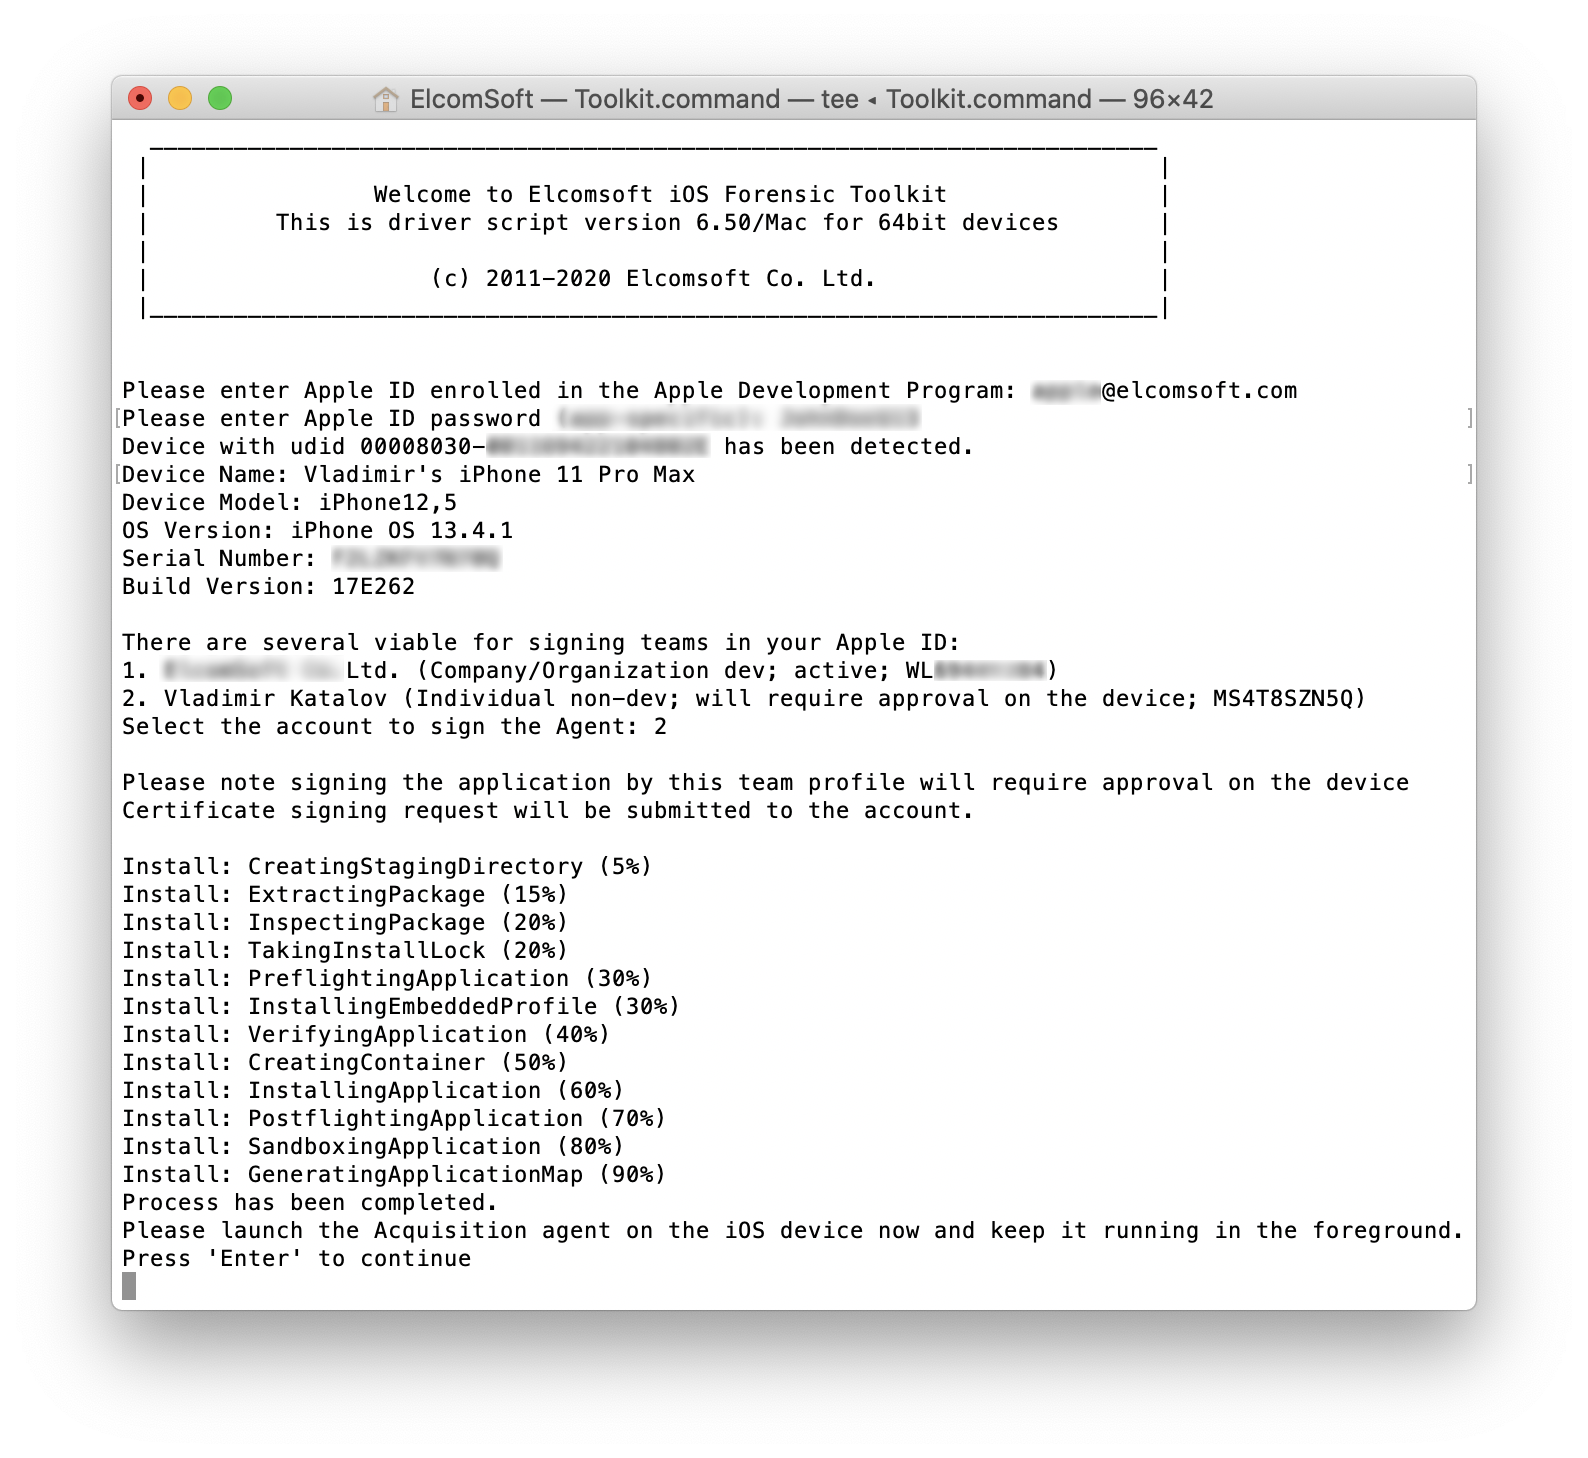
Press 1 to sideload the agent onto the device. Note that you will have to pass two-factor authentication by entering the original Apple ID password (not an app-specific password as you previously would), and then one-time code (will be pushed to a trusted device).
Verify the extraction agent on the device. This will be using Internet connection. Once you verify the extraction agent, launch it by tapping its app icon.
Press 2 to extract and decrypt the keychain
Press 3 to extract the file system image
Press 4 to remove the extraction agent from the device
We strongly recommend extracting both the keychain and the file system as the content of the keychain could be used to decrypt certain app data (e.g. WhatsApp cloud backups, Signal and so on). The file system image can be analyzed in in Elcomsoft Phone Viewer or another forensic product.
Conclusion
Since November last year sideloading apps onto iOS devices had become more challenging. Apple made changes to its provisioning service, effectively breaking sideloading for all but the users of a paid Apple Developer account. We have discovered a way to enable the use of regular and disposable Apple ID’s for the purpose of agent-based data extraction. All you need is the latest build of iOS Forensic Toolkit, a Mac computer, and a cable to connect the iPhone to the Mac. In this guide, we’ll demonstrate how to image an iOS device with a disposable Apple ID.
iOS Forensic Toolkit for Mac circumvents the provisioning restriction that obliges users to use an Apple Developer account for imaging iOS devices. The Mac edition once again allows experts to use regular or throwaway Apple IDs for extracting the file system and decrypting the keychain from compatible iPhone and iPad devices. However, if one already has an Apple Developer account, we recommend continuing using that account to sideload the extraction binary due to the tangible benefits of this approach.
Windows Process Internals: A few Concepts to know before jumping on Memory Forensics [Part 5] – A Journey in to the Undocumented Process Handle Structures (_handle_table & _handle_table_entry)
In this series of articles of “Must know Process Internals for Memory Forensics”,
we have traversed through ActiveProcessLinks (doubly-linked list) of EPROCESS in Part-1 to understand how memory manager keeps track of active processes on the system.
In Part-2, we have explored and traversed through Ldrmodules of _PEB structure that gave us insights how memory manager keeps track of all the loaded Dynamic Link Libraries (dlls) by a specific process.
In Part-3, we discussed about how system tracks loaded kernel modules by traversing and exploring nt!PsLoadedModuleList.
In the latest part, Part-4, we saw the details of Virtual Address Descriptors (VADs) and identified the details buried in to the VAD nodes.
This article would be Part-5 of the series and this would, most probably, be the last article (for now) of the series. In this Part-5, we will explore the kernel structures associated with Process Handles and how OS stores handle information for each process in the memory. The kernel structures related to handles have gone through a frequent change during each major version upgrade of the operating system. Windows 7, Windows 8, Windows 8.1 and now latest Windows 10 – all of these have different handle structures and a unique way to reference or to keep track of the handles in to the memory. I would say, Microsoft is introducing more and more complexity as they evolve hence from the forensics perspective, it has become harder to reverse these undocumented complex structures.
In this article, we will explore the kernel handle structures of Windows 10 (build 18362) via live kernel debugging. We will start with EPROCESS structure of one process and will follow through the cues provided by the handle kernel structures to reach to the actual Object and Object type that has been referred by a specific handle. Let us start the journey in to the kernel handle structures!!
What is a Handle, anyway?
If a process needs an access to any object such as a file, registry key, mutex, process, thread etc., it needs to get a hold of its handle first. Then the process can use this handle to get an access to the object referenced by this handle. The handle is a reference to a kernel structure that holds an information about the object that the handle refers to.
We will decode this jargon in the following sections. You may like to re-read this information after reading the entire article.
How Memory Manager keeps track of Process Objects & Handles?
Please refer to the following diagram that helps us to understand how OS stores information related to process objects and its handles. Each process has a executive object structure called EPROCESS in the kernel memory. This EPROCESS structure has a field named “ObjectTable”. This ObjectTable is a _handle_table structure. This structure has a field named “TableCode”. TableCode provides the reference to the base of the handle table entries (_handle_table_entries). You can see in the diagram below that there are indexes (0x04,0x08,0x0c and so on) are written to the adjacent to each handle_table_entry. When we say that process has got an access to the handle of an object – that essentially means that the process knows which index (represented by a handle) to go to in the handle_table_entries retrieve the pointer to the object that it needs an access to. Therefore, handle is nothing but the index in to this handle_table_entry. A process uses this index/handle to retrieve the information about the object that entry points to.
These entries are of _handle_table_entry structure. This structure contains the field named “ObjectPointerBits” that points to the object_header and we can get the address of the object from object_header. The object_header contains a field named “IndexType” that points to the structure _object_type that gives us an information about the type of the object this header referring to OR in other words, what type of object (like file,mutex, directory, process etc.) structure to expect after the object_header. This is important because handle table entries are mix of all objects that process has open handle to and TypeIndex lets us know about the type of object refereed by a specific handle.
Exploring the handle structures through kernel debugging
Let us review all of these structures discussed above through live kernel debugging.
First of all, enumerate the active processes & pick any random process for our exploration. I have picked up a process that has its EPROCESS structure at 0xffffa703b3ebc080 address. Now, let us examine its ObjectTable by enumerating EPROECESS. Once, we get the ObjectTable, we can enumerate it and the get the address of the “TableCode” as “TableCode” is one of the fields in the ObjectTable. Please see following snippet for the same.
Now, let us enumerate what we have got at the TableCode. We expect to get the handle table entries at the address provided by the “TableCode”. We can derive base address of the hande table entries by ANDing the TableCode address with ~0x07.
Please refer following snippets for the same. As expected, we have got the base address followed by handle table entries.
We have got the handle table entries now. These are nothing but the handles to the actual object. As mentioned earlier, each handle table entry is of structure type _handle_table_entry. _handle_table_entry has got a field named “ObjectPointerBits” that points to the header of the object that is referred by that handle entry.
Let us take handle table entry at 0x14 index. The address at 0x14 index is 0xffffba8a1e3f1050. Let’s us enumerate this entry to get the pointer to the object.
We need to get object_header from “ObjectPointerBits”. The simple way of doing it add 0 at the end of the and ffff at the beginning of the “ObjectPointerBits” to complete 64bit pointer address.
I don’t know how it works but I could get the pointer to the object header by leftshift (<<4) and ORing the result with 0xffff000000000000. The derived hex number is a pointer to the object header. This is represented by _object_header structure.
Now, let us enumerate the _object_header and get the to the _object_type to identify the type of object followed by this object_header.
As I said in the introduction of the article, Microsoft has made it more complex as they evolve with the operating systems. In earlier version of the Microsoft (like Windows 7) this TypeIndex is an index to the nt!ObTypeIndexTable,however, now this field does not refer to the direct index in to the ObType table. We need to derive the lookup index from the “TypeIndex” field and then use that index to lookup the type of the object in the nt!ObTypeIndexTable. To derive the lookup index from the: TypeIndex”, please perform following operations on the “TypeIndex”. We need to take the second least significant byte from the header. In our case,
object header is 0xffffa703`b2c47ae0 hence second least significant byte would be “7a”.
IndexType value is 0x68 and
Nt!ObHeaderCookie value is 0c
To derive lookup index, we need to XOR all these 3 values.
So, our lookup index is 1e. We can now enumerate object type by looking up in to the nt!ObTypeIndexTable.
As we can see the object type is TpWorkerFactory.
We can verify the same by enumerating the same handle through !handle in the windbg.
As expected, the all values are matching.
So, folks, we started with EPROCESS and reached to object_type by following cues provided by the various kernel structures. I hope you enjoy this reading.
That’s it for now, folks!! Happy hunting, fellas!!
TikTok has been with us for a couple of years now but we haven’t seen people using it in their investigations much until now. The mobile app allows users to make their own short videos. Lots of people put a sound track over it and will sing or dance. However, some people upload clips of video games, some use their own audio, and overall it allows people to be creative and come up with their own new content.
The app appears to be most popular among younger audiences, but a lot of adults can be found on it too. Many people post content, but others just watch and comment on other people’s content. Some comments are innocent, others are not. Despite this, people continue to post videos showing what schools they go to, videos inside and outside of their houses, and even give away phone numbers and other personal information, which is what this blog is going to focus on.
What information is being exposed?
A lot of TikTok users are quite young and don’t yet understand the consequences of putting their personal information out there. There are plenty of adults who do the exact same though. I have seen people posting emails, phone numbers, links to other social media, ID cards, passports, and a load of other personal identifiers like their height and age. This is often due to them following ‘trends’ where someone has done it and got good reactions, so everyone starts to do it, despite how dangerous it could be. Here I want to show how easy it is to find this information.
Above is the ‘Discover’ tab on the TikTok mobile app. It shows trending hashtags along with popular videos. What I want to focus on is the search bar because we can search anything from usernames, keywords, songs, and more. One of my first searches was the phrase: ‘phone me’.
When you get results, you can select between the different tabs like users, videos, sounds, hashtags, but for generic searches you can stick with ‘Top’ to show the most popular videos that you want. My first search returned a lot of results where people have posted their phone numbers either in the video description or as text in the video itself. The first result is my favourite where they reveal the number except the last digit as if it’s challenging to go and try ten different numbers.
Below is one example where you have to watch the video because they use text to show their number in it. There are some videos where they will only show the number for a fraction of a second and it would be almost impossible to pause it in time on mobile. In these situations, you can use the browser version to have more control over the video. I’m not showing the browser version in this blog because it has been covered a lot in others already.
Sound Tracks
You may notice when you are watching a TikTok video, you can see at the bottom what sound track is playing. It is the part next to the musical symbol. Sometimes these will be famous songs, and other times it will be an original sound made by a TikTok user. In the previous image, the track is from a user called ‘alecgiacchetto’. TikTok allows you to click on where it says the track name and it will show you all the other videos that use the same sound. At the time of this screenshot, 19.8k videos are using this sound, but I know it has gone up a lot since.
This particular sound isn’t music, it is just the user talking and this is what they say throughout the video:
“Everyone always post’s their phone number on here and then it blows up and they have to change their number but you know, i’m not famous, so, FaceTime me.”
This means that the majority of these videos will now have their phone number in so that people can FaceTime them. Some have their email address instead because they say they “aren’t comfortable” sharing their phone number… Some will also not share anything and will try to joke around by showing the number ‘911’ for example.
Here are some other examples of where people have posted their email addresses. I found these by searching for ‘gmail.com’. This can be done with any domain or phrases like ‘email me’.
One more example before we see what we can get from pivoting off this information. There is a sound track about how people look in their ID pictures. People use this track on their videos where they show their ID’s. Sure, many of these don’t reveal the full thing. However, most have their signature and date of birth under their picture and out of the 1448 videos posted with this sound track, I am sure some will show the full ID.
Pivoting
Now that we know the kind of information that people are sharing, what else can we find using it? First we will use the one where they give a phone number and leave out the last digit. How can we confirm the full phone number?
There are many ways to do this so I am going to show a few here and explain how they can work well together. Also, although all these are UK numbers, the same kind of techniques can be used for both numbers and emails from all around the world.
The first place I went was the Facebook forgot password page. I could enter the phone number provided and search each digit at the end. While you may find that multiple numbers exist as you try them, this is unlikely. At least you are finding which numbers definitely exist and are more likely to be active numbers that are in use.
In this case, 6 was the winning digit. All the others returned an error saying no account was found, but using 6, an account was found as you can see because it shows the recovery option. Although this in theory could belong to someone else, it is what I focused on first because I knew it existed and was being used on social media.
The next step I took was adding it to my phone’s contacts list and importing that to TikTok. The top result in the picture below was the same account we got the phone number from. I have redacted a lot but you can see the username here starts with ‘lil’ as did the one from the original video.
Similar to TikTok, you can import your contacts to Snapchat too. Doing this revealed her username which in this case contained her real name too. The ‘Aaaaaa’ part was what I set in my contacts, but the username under it was the one she set up herself. Now that we know her real name, we could search that on other social media too if we wanted. This is how easy it is to take one piece of information and pivot to find lots more.
Another approach to pivoting from this information is Lampyre. This is a piece of software which allows you to search identifiers and it will return whatever it can find on them. My favourite is their phone and email search because of how accurate it is and the unique results it returns.
Below I searched four UK phone numbers from TikTok. Although not much was returned this time, it is possible to get a lot more, it just depends on your target and what they use their phone number for online. We can now see that two of these numbers return partial data from Facebook recovery options. Partial emails are often easy to guess depending on how careful the user’s are. The other two show that they are connected to WhatsApp accounts, so now we could go and check WhatsApp with the numbers in our contacts list and see if it reveals a profile picture.
Below is an example of searching an email on Lampyre. Once again, it only brings back information directly connected to the email. Here it has returned partial details like a phone number from PayPal and Apple, a direct link to their LinkedIn account, and confirmation that the email is being used on sites like Pinterest and Spotify although it doesn’t go directly to the account here.
Lampyre is currently in a 2 week closed beta which I am involved in. I tried out one of their new searches with an email address I found on TikTok and it returned a Tumblr account. When I went to check out the account, lets just say, it was full of some ratherrrr explicit content. The username on the account was completely different to the one on TikTok too so finding the Tumblr was only possible because they thought it was good to share their email with the world.
Conclusion
This blog could go on forever, there were so many other examples of sound tracks people were using while exposing sensitive information, more ways to pivot and find new data on them, but I thought I would leave it here for now. I hope at some point people start to realise that what they are sharing online is sensitive and if bad people got their hands on it, who knows what could happen.
Extracting memory from Samsung devices to decrypt Samsung Health DB’s can uncover critical data for investigators
Samsung Health is a wellness application that helps users track their physical activities. As one might expect, the application stores a lot of interesting location data that interests the forensics community and specifically law enforcement investigators. As of today, no commercial tool decrypts the database of the application as Samsung uses Android’s “KeyStore” to encrypt and decrypt their data.
In this blog, I will demonstrate a method to decrypt the databases and extract meaningful data using a RAM dump. The phone’s RAM stores the decryption keys for the application after extracting the relevant keys from KeyStore and manipulating them. I will present an end-to-end procedure that starts with the RAM extraction and ends with the decryption and display of Samsung Health’s databases.
I hope that by releasing this blog the mobile forensics community will be inspired to continue to examine memory dump methodologies and spark the community to share their findings.
Motivation
My research started when our decoding group decided to focus on finding location data in Android environments because of COVID-19. We looked for popular applications that store the user’s location. Samsung Health runs in the background and stores the user’s activity even when the GUI application is not running or used by the user.
Samsung Health Brief
Samsung Health is an application that tracks various aspects of daily life contributing to well-being such as physical activity, diet, and sleep. The application was introduced to Samsung users on July 2, 2012 with the new Samsung Galaxy S3 smartphone. Today the app is installed by default on Samsung phones and on some models, it cannot be removed without root. It can also run on all recent Android and iOS phones.
Samsung Health Cryptography Internals
The Android KeyStore system lets you store cryptographic keys in a safe location in order to make it difficult to extract them from the phone. The keys can be used for encryption and decryption operations without entering the application because the cryptographic operations are handled in the operating system with a hardware-backed system.
First, it’s important to understand how Samsung Health runs. Samsung Health executes two processes:
“com.sec.android.app.shealth:remote” – A none-graphic background process that runs all the time, even when the user is not actively interacting with the application. This process collects pedometer data and handles database operations.
“sec.android.app.shealth” – A graphical application that the user can interact with.
When exiting the GUI application and killing it. The background application still runs and collects data.
Samsung Health has a large infrastructure for cryptographic operations on data. The application performs the following steps to get the decryption key to decrypt its database:
It opens a file called “aks” (initials for Android KeyStore)
It then decrypts the file using Android KeyStore key and iv generated from the output of a custom hash function named “getMagic.” This is implemented in a shared object called “libload-strings.so,” which gets a SHA256 of a unique Android id as it inputs and outputs the iv.
The decryption of the AKS file looks like this:
The IV creator looks like this:
3. The decrypted data is used as a key for decrypting the sqlitecipher database.
Sqlitecipher is a cryptographic framework that wraps sqlite databases and supports decryption and encryption of sqlite databases. Samsung Health has implemented this framework in their code by a shared object called “libsecsqlite.so.” This shared object holds all the capabilities of sqlitecipher and has its own “special” configuration.
The shared object uses its own default configurations, these functions point to these default values:
The shared object gets a key from the Java application (as explained above) and generates the derived key. The derived key is stored as a format of: x’<96 characters of a-f or 0-9>’.
Finding The Key For Decryption
Extracting the key from a normal filesystem dump is not possible because the key is generated through Android KeyStore, which, as explained previously, is stored at a safe location that cannot be extracted in a normal filesystem dump. To extract the key, we found the following methods:
Frida framework (requires root)
Frida is a dynamic instrumentation framework that allows you to hook into applications for reversing, debugging, and research purposes.
As mentioned above, Samsung Health runs two processes. The first is the background process that runs without a GUI application. The other is the GUI application.
In order to hook the relevant functions that decrypt the databases, we need to hook the “com.sec.android.app.shealth:remote” process.
It is crucial to hook this process when it spawns, as it decrypts the databases at the start of its run time. To do so, spawn-gating is required.
RAM dump (used SBOOT dump – no root required)
Another way is extracting RAM data from the phone and finding the keys used to decrypt the databases. I expect the key to be in the RAM as the process is always running in the background and doing cryptography operations on the databases.
Extracting RAM Data
There are various ways to extract RAM data from an Android phone, in this blog I will only explain about S-Boot dump related to Samsung phones only, which requires no root privileges on the device.
Samsung has its own debugging mode called “Upload Mode.” Upload mode is a basic protocol that dumps memory from a device. It is used for debugging and reversing purposes; Samsung can use it to look at registers and stack memory to understand crashes.
The way this protocol works is by accepting a start and end address of the physical memory to be extracted and returns the memory dump. It can be used to dump the full range of memory as well. It does not require root, but it does need to be configured from within the phone.
How to make an SBOOT extraction:
Enter upload mode:
Dial *#9900#
Turn “Debug Level” to High
If possible, enable UploadMode
Force reset your Samsung phone by holding “Power” + “Volume down”
After the phone has shutdown. Hold “Bixby” + “Volume down”
The sqlitecipher keys are stored in the format mentioned above. To find those keys in the memory dump, extract all the strings from the memory dump and find (with regex) the sqlitecipher key
strings * | grep -E “x'[a-f0-9]{96}'”
The keys extracted:
The key relevant to Samsung Health:
In the next version of the Cellebrite Physical Analyzer (PA) we implemented a Samsung Health decryptor that when given a RAM dump, decrypts the databases and parses the locations from the DB:
Decrypt Using Cellebrite Physical Analyzer
To decrypt using PA, follow these steps.
After gaining the memory folder and the File System extraction:
Move the extracted memory folder into a directory with a <FOLDER NAME> of your choosing
Move <FOLDER NAME> directory to the same path of the .ufd file
In the .ufd file, under [dumps] Add:
Memory=<FOLDER NAME>
[Memory]
Type=Folder
Open the .ufd in PA
The parsers that should run are “SbootDumpPasswords” and “Samsung Health.”
The keys extracted are shown in the tables in SecureHealthData.db:
Locations that are stored by default under SecureHealthData.db:
Locations that are stored under SportTracker.db (after some exercise) are shown below.
Locations mapped to models in PA look like this:
In Summary
Samsung Health uses strong cryptography methods that involve unique libraries. In order to extract meaningful information from the application, there is a need to extract decryption keys from the process’s memory. This is why knowing different methods to extract the key, how the decryption flow works, and how a detailed flow using SBOOT dump to decrypt the application’s databases via Cellebrite’s Physical Analyzer is so important.
Volitile memory analysis could provide a solution to parse data that could not be parsed using a filesystem dump.
Learn more about how Cellebrite’s Digital Intelligence solutions can help your investigations here.
Sysmon 12 is out, with a new event ID: number 24. A very useful new feature, clipboard monitoring.
Now there is an obvious great use for this in forensic investigations during and after an incident. However, there are additional ways to use this to also trigger detections on.
There obviously will be sensitive data in here as well, like passwords, keys, personal information and so on. Therefore the information is not directly captured to the event log and as such not centrally aggregated, since then it would be accessible for many people.
Event ID 24 generated after a copy to the clipboard in PowerShell.
The new event contains the following fields:
Image: The process that recorded to the clipboard.
Session: Session where the process writing to the clipboard is running. This can be system(0) interactive or remote, etc. ClientInfo: this will contain the session username, and in case of a remote session the originating hostname, and the IP address when available. Hashes: This determines the file name, same as the FileDelete event. Archived: Status whether is was stored in the configured Archive directory.
Default archive directory, Sysmon, with a clipboard capture.
The clipboard files are written to the same protected folder as the File Delete (ID23) archives, as described in this post. The are prepended with the CLIP- tag and have the same file naming scheme, the hash configuration you use.
The files themselves contain the exact data that was copied to the clipboard.
Sample clipboard capture.
‘Drive-by’ captures
Another interesting case is where Sysmon captures text on the clipboard that is not pasted yet when switching to a VM (or RDP session). This might give very useful insights into attacker behavior or mistakes. For instance, if you have something on the clipboard and hop between RDP sessions, this information will travel with you.
Obviously this is also true for administrator behavior. It’s highly likely you will be capturing passwords they copy/paste into RDP sessions as well; take this into account in your risk assessment.
How about password managers?
Password managers use the clipboard as well, unless you use the autofill feature, which also has its problems on another level. Having Sysmon on a system with a password manager will have you capture passwords.
In the example below I’ve installed LastPass, one of the popular tools, created a test credential set and then pressed the copy password button. Sysmon records it, sadly not invoked by the program itself (lpwinmetro.exe), but by svchost.exe. Filtering password managers therefore will be not as simple, so please take this into account.
Capture of a copy password click.
Note: this was a brief test with only one password manager. In time it would be useful to investigate several tools and versions in order to create a whitelist.
Another option could be for instance to filter svchost.exe, making sure you won’t capture passwords from your password manager. This might potentially blind you from capturing other processes. This will require some more research in your environment to properly make this call.
Applications
As mentioned before the forensic use of this feature is immediately apparent, even some red teamers / malicious attackers might see some benefit here — which you might want to put some file auditing on and alert on whenever a process other than Sysmon is accessing this archive folder.
Another possibly use is to create a baseline of tools writing to the clipboard and create some detection logic on anomalies.
Furthermore having the originating user / hostname and IP address will provide another means of triggers since unauthorized RDP /remote sessions can be detected this way. When an attacker copies over a script to be executed directly on the command-line for instance you’ll be able to recover this or, as mentioned before, all commands they intended to execute.
Configuration
To enable it is fairly simple and similar to all other event types. A very basic example is:
This material comes from our Software Reverse Engineering course. During this tutorial you will learn how to tackle disassembling high level languages on a simple example. It's a complex task that can't be fully learned with a single article, but this is a great place to start!
Every binary that you have in your system usually was made in a high level language, but you don’t always know the language. Sometimes it’s possible to revert or decompile your binary into the original source code. Disassembling is not an easy task; with some specific codes it is possible to do this, but you will not know the name of the variables or the comments inside the code (for example). But you can always see the binary, convert it to hexadecimal and then interpret each byte, or group of bytes, as an instruction (as you learned in the last section). You can do it manually or use a specific disassembling tool to do this.
In the Table 21 we have a list of tools that you can use for disassembling x86 code:
Table 21 – Some disassembler for x86.
Tool
X86 Architecture
Operating System
Interactive Disassembler (IDA)
32 and 64
Linux / Win
OllyDbg
32
Win
Hack
16
DOS / Win
NDISASM
32 and 64
DOS / Win / Mac / Linux
Of course there is much more than this, you can take a look on the Internet and check some free, open source and commercial disassembling tools that you can use for this purpose. In this course, most of the time we are going to use OllyDbg or IDA (32 bit free version), because it is free and easy to use. The bad thing is that it only runs on Windows. In Linux examples, we are going to use NDISASM, that comes with NASM. One of the best disassemblers is Interactive Disassembler, or just IDA. This software is capable of disassembling code from various architectures, not just x86. They have a free x86 32 bit version for Windows. The full version, that runs on Linux and a bunch of different architectures, is very expensive.
Analyzing the Program
There are a lot of things that you should think about before doing reverse engineering to a binary program. Usually, you want to modify something, like removing a message that appears in a certain moment.
Sometimes you just want to change the value of a constant or variable, other times you may need to fix a bug in an old legacy code.
It is really difficult and unprovable to do reverse engineering on the whole code, because the binary is usually coded in a high level language, and when you attempt disassembling the code, you will have many more lines in Assembly language compared to the original source code in a high level language.
One good example to clarify this is thinking in a LOOP coded in a high level language. Let's suppose that you have a C code like the following (Figure 4):
for (i = 0; i < 0x1212; i++)
{
}
Figure 4 – A loop coded in C language.
The above code is really simple; as you can see it does nothing, just repeats for 1212 times (the 0x indicates an hexadecimal value). Just remember the syntax of the “for” loop: first parameter (i = 0) is the initial condition; second parameter (i < 0x1212) is the stop condition and the third parameter is the increment (in this case the same as i = i + 1). To understand what happens with the coder after you compile it, we did the compiling process in two different environments. The first one was done with the old Borland Turbo C (3.0).
After we had compiled and linked the source code, we got the binary. Thus, it was possible to disassembly the binary and analyze the Assembly code. Let's take a look at Figure 5.
XOR SI, SI
JMP SHORT loc_1029A
loc_10299:
INC SI
loc_1029A:
CMP SI, 1212h
JL SHORT loc_10299
Figure 5 – Disassembly of the binary loop compiled in Turbo C 3.
To disassemble the code, I used the IDA Free for 32 bits. Do you think you can understand the relationship between the original C code and the disassembled code? Let's explain a little to you.
The instruction XOR SI, SI you can understand as the “i = 0” (the first parameter from the original C code). How do we know this? It is easy: when you use XOR (Exclusive OR) using the same value for the both parameters, you will get a zero as a result (if you don't know how a XOR works, please look at the references).
Let's jump to the instruction INC SI. This one means the third parameter, which is “i++”. This one is really easy to identify, because the Assembly instruction INC just increments one register that you specify. In this case, we are using the pointer register SI, which was previously started with zero.
Going back to the second parameter (“i < 0x1212”) and looking in the disassembly of it, you will observe that we have more than one Assembly instruction to represent it: JMP SHORT loc_1029A, CMP SI, 1212h and JL SHORT loc_10299. The first Assembly instruction (JMP SHORT loc_1029A) is an unconditional loop, just meaning that the code will jump to the specified label (observe that the label is just a reference to the memory address, but the IDA disassembler helped us by putting a name on it).
When the code jumps to “loc_1029A”, you will see that we have the instruction CMP SI, 1212h (our second Assembly instruction related to the “i < 0x1212”). This is an ALU instruction, which compares the register SI with 1212h and sets the flag bits in the Flag Register (section 2.1.4). Actually, the instruction CMP acts as a SUB (subtract), the only difference is that instruction CMP does not save the result, just changes the flags. Now that we have the flags updated, we can analyze them using a conditional jump, in this case JL. As you can can see in the third instruction related to the “i < 0x1212”, we have a JL SHORT loc_10299, which means “jump if less” referring to the “<” symbol, originally present in our C code.
Note that it was really fast and easy to analyze parameters one and three from our “for” loop present in the C source code, just the parameter number two takes a while to understand the logic, but it is also easy.
Now, let's see what we get when we compile the same C code using “gcc” compiler (Figure 6).
JMP SHORT loc_401354
loc_401350:
INC [ESP+10h+var_4]
loc_401354:
CMP [ESP+10h+var_4], 1211h JLE SHORT loc_401350
Figure 6 - Disassembly of the binary loop compiled in GCC.
As you can see, the Assembly code is not the same, there are a lot of different decisions made by the compiler that resulted in a different OPCODE combination (that we are seeing here as Assembly instructions).
Let's start thinking about our loop parameters: i = 0, i < 0x1212 and i++. What happened to the first parameter (i = 0)? Well, here it is difficult to see, but the “gcc” compiler decided to deal with the variable “directly”, without moving it into a pointer register (e.g. SI, as we saw before). To clarify this situation, let's jump again to the third parameter (i++), which will help us also explain the first one. The Assembly instruction INC [ESP+10h+var_4] is the one responsible for incrementing the variable “i” table that originally controls the loop. The first thing to observe here is the fact that the compiler generates a 32 bit code, as we can see in the ESP register (section 2.1.2). The other thing is that the brackets “[ ]” indicate that we want the address pointed by “ESP+10h+var4”, which means that this is the place where the original variable “i” is located (which answers our question about the first parameter: “i = 0”).
The third parameter, “i<0x1212”, one more time should be analyzed as a subset of Assembly instructions: JMP SHORT loc_401354, CMP [ESP+10h+var4], 1211h and JLE SHORT loc_401350. The first Assembly (JMP SHORT loc_401354) instruction has the same purpose mentioned before, just jump to a label and execute the second Assembly instruction (CMP [ESP+10h+var4], 1211h). As you can see in this instruction, again we are looking into the address point by [ESP+10h+var4] to see the value of the variable. The interesting thing here is that we are comparing the variable “i” with 1211h. Why is this happening? In our original C code, we had compared the variable with 1212h. Well, the compiler “decided” to change the value and to deal with this change, it also changed the next instruction. In the third instruction (JLE SHORT loc_401350), instead of the JL mentioned before, we have a JLE, which means “jump if less or equal”. This is how the compiler dealt with the comparison made by the second instruction. Instead of comparing with 0x1212 and “jump if less”, it decided to compare with 0x1211 and “jump if less or equal”, which means “the same thing” in the end.
Changing the Binary
Let's suppose that you want to change some binary code that you already found, for example, the comparison that you found before (section 4.1). As we know, the comparison loop will continue running until the second condition becomes false (i<0x1212).
Imagine that you do not want to enter in this loop anymore, but you do not have the source code to do this, then you have to do something with the binary. One of the easiest ways is to change the address of the unconditional jump (JMP) to the next instruction right after the conditional jump (JL or JLE).
Another possibility is to change the value of the variable before making the comparison (CMP). In the code compiled with “gcc”, you will have to change the value pointed by [ESP+10h+var4].
In some cases, we may want to remove a message that appears, or maybe a window. In these cases, we usually have a CALL (Assembly instruction to call a subroutine) that we should “remove”. Actually, we will need to change to another instruction, as we will see in the next subsection.
Number of Bytes
When we want to change something in our binary, we have to pay attention to the fact that we cannot change the number of bytes. It is one of the security mechanisms related to binary files, but we are not going to discuss this here.
The fact is that we have to pay attention to this if we want to make permanent changes in our binary. In section 4.2, we mentioned the JUMP example. In this case, it is really easy because we are just going to jump to the next “label” or instruction.
But when we want to omit a CALL, we have to put something there to replace the old bytes. We need to put something there that will not change the behavior of the other parts of our program. Thus, it is very useful to use the instruction NOP, that does nothing! This instruction has one byte (0x90) and we can put as many as we need without changing the number of bytes of our original file.
Supposing that the original CALL has three bytes, we just replace these three bytes with three 0x90, which means execute NOT three times.
Sum of Bytes
Another issue that sometimes we have to deal with is the fact that some binary files have a mechanism called CHECKSUM. This kind of thing is really common in Computer Networks Protocols, for example.
The CHECKSUM is a sum of all the bytes of the binary file, but with a limit of some bytes (e.g. 2 bytes). Let's suppose we have code with the following bytes: 0x10, 0x22, 0x35. In this case, the CHECKSUM would be 0x0067 (2 bytes).
Usually, this field is somewhere at the end of the binary file, and if you change one of your bytes (e.g. 0x10 for 0x11), then you will also have to change the CHECKSUM field to the new value, in this case 0x0068.
Today we take a step back towards the most basic OSINT resource – the Google search engine.
Google products are often labelled as privacy unfriendly, equipped with built-in overt and covert features that concentrate on tracking users’ online activities and their physical movements.
That said, the Google search engine remains the best and the most effective out there, which makes it impossible for any OSINT practitioner to disregard.
Anybody can google – but the results will vary drastically.
With speed, accuracy and efficiency in mind, the objective is to refine, narrow down, isolate and prioritize your search results by using a correct combination of sources (websites) to query.
This is the true power of Google custom search engines (CSEs).
So let’s take a look at how they work and how to build them.
To create a custom search you will need a Google account.
Select New search engine and pick an appropriate name.
As seen above, you can add websites that will be searched for against your query and also filter by language.
You can decide here whether you want to search whole websites (for example, the whole of Reddit), or just the selected parts (say like various Reddit threads), or maybe specific subdomains that belong to the main site, which you might wish to omit in your search.
If you are unsure about how domain addressing works, check out this post that contains an explanation on web domain addressing structure.
After you have created your custom search engine, you can modify it and change the parameters using the “Edit search engine” tab.
You can also choose to embed a CSE you created on a website (or link it up via traditional URL pasting / shortening methods outside of this panel).
One helpful option is “Refinements” – available under the “Search features” section, after you’ve chosen to edit the search engine.
This will allow you to limit search result to a specific website per refinement, but you can display multiple results segregated by tabs, each with their own results:
Refining search results by file formats and file extensions will allow you to build effective custom search engines for PDF documents, Excel spreadsheets, video files and whatever else you want to focus on.
By applying the method described above, you can filter your search by limiting results to files with a specific file extension.
This will require specifying the “Optional word(s)” value in a way that Google understands as filtering by file extension, for instance:
ext:pdfext:jpegext:ppt
The main advantages of building custom search engines with Google are accuracy of sources and results limitation.
The trade off is that your results will be limited to 10 pages, with each page displaying only 10 results – so you get a maximum of 100 hits per query.
This means you really have to define your queries well and avoid broad searches – for which you can always use the general Google search engine.
So that’s it in a nutshell; there are some more granular options within the CSE interface that you can explore and tweak to make the results display better or be more relevant to your OSINT angle.
Or, if you are feeling lazy, you can use some of my own custom search engines that I share below…
Social media sites
Linkedin – searches for individuals, businesses, keywords and more.
Facebook – searches for persons, user names, keywords, groups, posts, etc.
Twitter – searches for items of interest within user names and tweet content.
VK – searches through a popular Russian speaking website, V Kontakte.
Forums & chats
Reddit – global search of the entire Reddit platform.
Telegram – channels and content on Telegram. I recommend using the desktop app to navigate results.
Bitcoin Forums – 10+ various digital currency discussion forums (including some sub-reddits).
People search
People Search Websites – a bunch of websites that gather personal data, search by name & surname.
Dating websites – most people don’t use real details on dating sites, so search for pseudonyms.
In this video from our Shodan, IoT, and OSINT blast course your instructor, Maciej Makowski, will show you how to use Shodan in the CLI. While Shodan's GUI offers great options to play with, sometimes you have to go a different route for best results. Dive in!
The course will focus on finding security vulnerabilities in the Internet of Things online devices using Shodan. This workshop will be especially useful for those who want to learn more about OSINT, cybersecurity, and technology in general.
Topics discussed in this course:
Shodan interface
Shodan results export options
Searching for IoT devices by location - Shodan Maps
Shodan Exploits section
Searching with image files (e.g. static login pages)
Shodan internals - searching for VNC banners
Search filters with practical examples
Refining searches for best results
IoT practical search examples
Searching for ICS devices in Shodan
Understanding proxy and VPN impact on Shodan for privacy and security
Shodan in the CLI
Defending from Shodan
Shodan hands-on tips and tricks
Practical exercises and knowledge checks are included in the course, all participants must pass them to receive a certificate.
What skills will you gain?
Search for IoT devices on Shodan using various methods
Identify vulnerable IoT devices
Search for exploits for IoT
Use Shodan through GUI and CLI
Perform OSINT tasks
Search for ICS devices on Shodan
Hide your devices from Shodan searches
What will you learn about?
How to use Shodan for searching IoT device landscape
The current state of IoT devices detectable by Shodan
Various privacy and OSINT techniques on Shodan
Proxy and VPN impact on Shodan results
Why THIS course?
This course will give you practical, hands-on exposure to vulnerability hunting specific to IoT as well as some digital intelligence gathering techniques. Focused on the topics of OSINT and IoT, it’s quick and can be done in an hour - but you will be able to put your new knowledge to the test in the real world right after you finish. If you were looking for a self-contained tutorial on OSINT, Shodan, IoT, or all of the above, this is the perfect course for you!
In this video from our new Network Monitoring with Security Onion online course we are going to see the various options for Security Onion Deployment Scenarios. For anyone wanting to get into SO this is a great place to start!
Do you have a requirement to identify the right framework and tool to monitor your own network? If so, this course is for you! This online course discusses Security Onion, a free and open source platform for network security monitoring, log management and threat hunting. Through a series of videos, this course will introduce network security monitoring platforms and deploy them through a hassle-free environment.
This course covers the tool and processes required to integrate network evidence sources into investigations, with a focus on open source, efficiency and effectiveness.
Why NOW?
Increasing demand for sophisticated cybersecurity tools to detect and investigate cyberattacks and financial frauds is expected to drive the market growth.
The network forensics market was valued at USD 2.01 billion in 2020 and is expected to reach USD 4.62 billion by 2025, at a CAGR of 14.9% over the forecast period 2020 - 2025.
Who is this course for?
Cybersecurity professionals
Network security analysts
SOC analysts
Systems administrators
Legal professionals
IT managers
What skills will you gain?
Network security monitoring
Intrusion detection
Threat hunting
Network forensics analysis
You will be able to perform network security monitoring in a production environment, and how to deploy your own Security Onion environment.
Here's a summary of Module 1:
Security Onion will provide visibility into network traffic and context around alerts and anomalous events, but it requires a commitment from the network administrator to review alerts, monitor the network activity, and most importantly, have a willingness, passion and desire to learn. This module focuses on core components, high-level architecture, and layers of Security Onion.
In this short video from our Digital Forensic Imaging online course we take a deep dive into drive geometry - this knowlege is crucial for anyone looking to acquire digital evidence - we have a feeling this might be you!
This course will give you the knowledge and skills to preserve and protect evidence with secure forensic imaging. Guided by industry standards and methods the student will learn and apply best practices to identify and utilize the most effective and defensible imaging methods. More than ever, this skill is of critical importance because creating and backing up a forensic image helps ensure evidence integrity presentable in court. Forensic imaging can also prevent the loss of critical files due to drive or other device failure. Students interested in the imaging process and image types including the underlying technology will find this course appealing, Technologies range from disk drive geometry and operating systems to hashing algorithms and bit-stream imaging. Whether you are interested in computer forensics or are already a forensic examiner this course if for you. There is more to forensic imaging and this course will explain why and increase your skills and knowledge implementing the forensic process.
While all steps in the forensic process have equal priority and attention to detail, evidence acquisition and preservation is arguably the most important aspect of the forensic process because this is where the case begins. One could also argue that forensic imaging is equally an important first step because, if done accurately, it preserves evidence in its original state and ensures that critical evidence will not be lost due to drive or other device failures. As such, it is critical to thoroughly understand forensic imaging to do it correctly so that there is absolute integrity in the subsequent handling, analysis, and reporting of acquired data. This course will give you the knowledge and skill in how to conduct forensic imaging flawlessly. By taking this course, you will gain insight into different imaging standards and methods as well as background knowledge in the underlying technology and how to connect image processing to your overall case.
Quite the description for Emotet coming from a popular online malware sandbox.
CISA, The United States Cybersecurity and Infrastructure Security Agency, has described Emotet in a 2018 alert as the “most costly and destructive malware” affecting the US private and public sectors, whilst in 2020 labelling it as “one of the most prevalent ongoing threats”.
Now that is some introduction for a strain of malware that has been around since 2014.
But, where did it originate from, who is responsible for it, and what makes it such an insidious piece of malware today still?
The ‘Genesis’ of Emotet
We’ll start our journey back in the year of Flappy Birds and Ice Bucket challenges. A few months after Flappy Bird was abruptly removed from mobile app stores in early 2014, a blog post appeared by Trend Micro analyst Joie Salvio which introduced the world to “new banking malware” detected as Emotet. Joie was however not responsible for naming the malware, and it appears that the reason behind Trend Micro calling it Emotet will forever be lost in the sands of time.
Although this 27 June 2014 blog post was seemingly the first time the world heard the name Emotet, it was not the first time the actual malware was observed. Security researcher Miko Hipponen noted the following message dug out from his industry mailing list archives from 2014: “Looks like someone found yet another name for Geodo, which we’ve seen since at least a month or more (mid to late May 2014)”
But first: Feodo
So let’s take a step back to 2010. This time I’ll spare you references to Fruit Ninja…
During the latter part of 2010, cybersecurity firm FireEye reported on a banking trojan called Feodo. The report noted that they have been seeing this trojan in the wild since August 2010, with similar traits to the then famous banking trojans called Zbot and SpyEye.
Now, this is where you need to keep your wits about you. The Feodo trojan was later on also referred to as Cridex or Bugat. Cridex is where another famous banking trojan called Dridex is said to have evolved from.
Fast forward again to 2014 (queue flappy birds stopping their flapping all too unexpectedly). Abuse.chreported in early June of that year that they were seeing a new version of the Feodo banking trojan “which some security experts started calling Geodo”. A few days after Trend Micro baptized Feodo as Emotet, Seculert also reported on a new version of Cridex (aka Feodo aka Bugat) whilst referring to it as Geodo.
The Geodo aka Emotet banking trojan continued to happily steal hard-earned cash from various victims between 2014 up until 2017 when a new version of Geodo arrived. The new version was called Heodo. (Now in keeping with the alphabet rotations, you would’ve thought that Geodo aka Emotet would then become Fmotet, but I guess that didn’t go well with focus groups, and the new Heodo malware was able to keep its Emotet naming.)
Here’s a quick Genesis summary:
First, there was Feodo (circa 2010), which was also known as Cridex or Bugat (although some might claim that Feodo was the successor to Cridex, and is not Cridex itself). Other researchers noted that Feodo was only first spotted in 2012.
In 2014 came Geodo (aka Emotet), the son of Feodo.
Finally, in 2017 came Heodo (aka Emotet), the son of Geodo.
As such if in the year of Our Lord 2020, someone is referring to an active Emotet campaign or infection, they are referring to Heodo, and vice versa.
Banking Trojan 101
So the question remains: What does a Banking Trojan do?
At its core, a banking trojan has the purpose of intercepting online banking usernames and passwords from infected computers. Once this data is obtained, it is sent off to their controlling syndicates to use for fraudulent transactions or even sold on for others to use.
This interception of banking credentials can be done in several ways:
Logging keystrokes typed on the keyboard of an infected computer.
Intercept username and password fields typed into logon forms.
Presenting victims with fake online banking login pages when they attempt to access their legitimate banking website.
Evolving With The Times
When Trend Micro analysed Emotet in 2014, they detailed how the malware would specifically monitor web activity on an infected machine. Once an online banking website was accessed which matched a predefined list of targeted banks, the malware would intercept the entered credentials. It was capable of doing this even if the banking website was accessed via an HTTPS connection.
We’ll call this Emotet version 1 (mainly because others did so)
Emotet version 2 and 3 came onto the scene that same year (2014), sporting functionality to automatically conduct fraudulent transactions on infected machines using automatic transfer systems (ATS).
In addition to the ATS functionality, Emotet went modular. This meant the malware had separate modules within itself which were responsible for different things, like stealing banking credentials, intercepting email login data, or distributing spam. Emotet’s loader was also changed into a separate module. A loader (in malware terms), is responsible for loading additional second-stage malware payloads onto the infected system.
Malspam All The Way
Since it’s early days, Emotet has been gaining its initial infections via malspam campaigns. That is spam emails that either contain malware as an attachment or a link that will download malware back to the victim’s computer. These email messages had themes ranging from financial communications to urgent courier delivery messages.
In the early twenty-tens, most banking trojan operators were relying on tricking their victims into thinking that the email attachment or downloaded file named Invoice.pdf.exe was an actual urgent PDF invoice and not something much more dangerous.
Emotet has since moved onto predominantly making use of malicious PDF documents or macro-enabled MS Word document email attachments, or a link to download either.
Mr. Delivery
In 2017, while Elon Musk and Mark Zuckerberg were fighting on Twitterover the threat posed by Artificial Intelligence, Emotet started its own delivery service.
This service evolved with the times and by July 2018, CISA labeled Emotet as a “modular banking trojan that primarily functions as a downloader or dropper of other banking trojans”. This meant that Emotet pretty much became a dodgy food delivery service, that will walk up to your door, ring the bell and when you open, smash a freshly cut sample of the Dridex trojan in your face. To round it off, the delivery guy will then jump your back fence and repeat the same ‘face-smashing-Dridex-delivery-service’ with your neighbors.
CISA estimated that Emotet infections have cost SLTT Governments (State, local, tribal, and territorial) up to $1 million per incident to remediate.
Emotet had five known spreader modules at this stage, which were put to work to allow it to further spread and infect other computers. These could be computers on the same network by attempting to brute force passwords, or using extracted email addresses from Outlook on an infected machine to send out additional spam emails.
Emotet’s delivery service business continued strong throughout 2018 and 2019. In late 2019, Emotet was observed making use of socially engineered spam emails: “Emotet’s reuse of stolen email content is extremely effective. Once they have swiped a victim’s email, Emotet constructs new attack messages in reply to some of that victim’s unread email messages, quoting the bodies of real messages in the threads.” Talos, September 2019.
In 2019, campaigns were noted where Emotet dropped the TrickBot trojan to steal sensitive information from infected machines. After TrickBot did its job, it would in turn download the Ryuk ransomware for a coup de grace.
The Spider In The Room
We still haven’t touched on the aspect of attribution. That is, who are the people behind Emotet?
One thing that is certain is that we have three names being used to refer to Emotet’s handlers:
The “Spider” in Mummy Spider is the umbrella term used to refer to cybercriminal groups that aren’t directly linked to Nation-State-Based Adversaries. Some researchers have also noted that Mummy Spider is a Russian-speaking group.
But, for now, this is the short answer you’ll get when asking the question “Who is behind Emotet”: A likely Russian speaking cybercriminalgroup.
Emotet Today and Tomorrow
To date, researchers have tracked three different botnets used to send Emotet malspam campaigns. Each of these has its own infrastructure, and are referred to by either Epoch 1, Epoch 2, or Epoch 3. The themes used with Emotet malspam campaign emails also adapt to the times or seasons. One of many examples is the recent ‘Halloween house party’ themed email lures that were used during October. The Emotet delivery service has also been pushing on, with the malware currently being tracked for delivering the notorious QBot (aka Qakbot) malware.
Development of the Emotet malware appears to be ongoing as a new Emotet loader-type was discovered in early 2020, giving it the capability to spread to nearby wireless networks with poor passwords.
Even though there was a five-month hiatus at the beginning of this year without any notable Emotet malspam campaigns, it is still on track to end the year with a bang. Some security firms have stated that they were seeing between 1000% and 1300% increases in Emotet detections in the past months.
Closing Rhyme
(it’s not lame if it makes you smile)
Emotet,
Not dead.
Has caused millions of dollars to be bled,
While helping the most treacherous cyber-attacks spread.
Stay safe.
Need help? If you are looking for mitigation techniques against Emotet, most major cybersecurity firms have published advice on how to protect against it. Here is a comprehensive list put together by CISA: https://us-cert.cisa.gov/ncas/alerts/aa20-280a
IOS 1-DAY HUNTING: UNCOVERING AND EXPLOITING CVE-2020-27950 KERNEL MEMORY LEAK
by Fabien Perigaud
Back in the beginning of November, Project Zero announced that Apple has patched a full chain of vulnerabilities that were actively exploited in the wild. This chain consists in 3 vulnerabilities: a userland RCE in FontParser as well as a memory leak and a type confusion in the kernel.
In this blogpost, we will describe how we identified and exploited the kernel memory leak.
Introduction
On November 5th, Project Zero announced that Apple has patched in iOS 14.2 a full chain of vulnerabilities that were actively exploited in the wild, composed of 3 vulnerabilities: a userland RCE in FontParser as well as a memory leak ("memory initialization issue") and a type confusion in the kernel.
Apple patching a full chain of vulnerabilities exploited in the wild is not something usual. This kind of discovery is very interesting for several reasons:
if the exploitation codes are made public, they give precious insights about the state-of-the-art exploitation methods for latest iOS versions, which include more and more security mitigations;
even if the exploitation codes are not available, the kernel vulnerabilities might be of great interest, a full chain implying defeating hardened sandboxing to be able to exploit the kernel from a userland application.
As Project Zero did not publish any details about the vulnerabilities nor exploitation methods, we started digging to find them ourselves.
Bindiffing made easy
Surprisingly, Apple chose to fix these vulnerabilities on older devices too, in iOS 12.4.9. This choice might be explained by Apple wanting to protect as many customers as it can, since these vulnerabilities are actively exploited in the wild.
From a security researcher point of view, this choice is a gift: we can grab a fresh iOS 12.4.9 kernel with the vulnerabilities patched, and compare it against an iOS 12.4.8 kernel: the list of changes will be minimal, as no new features are expected, and every change will likely be a vulnerability fix!
Getting kernels is not a complicated task: we can download the IPSW files corresponding to iOS versions 12.4.8 and 12.4.9 for an old iPhone version (such as iPhone 6) using the handy website ipsw.me, which is automatically updated with links to IPSW files by parsing the public XML files hosted by Apple. IPSW files are ZIP archives containing various files, including kernelcache.release.iphone7, which is the compressed kernel binary for our iPhone model.
Depending on the iPhone version, different compression methods can be used. The targeted iPhone 6 uses LZSS, as it can be seen in the compressed kernelcache header:
Now that we have the two kernel binaries, we can start diffing. We will use Bindiff 6 for IDA Pro, but other tools can also perform well.
A kernelcache consists in the kernel binary and many kernel extensions (kexts). IDA allows loading only the kernel, a single kext or the kernel with all its kexts. As we don't know yet where the vulnerabilities are located, let's load all the things!
Once IDA auto analysis has finished, we can run bindiff in the 12.4.8 IDA instance against the 12.4.9 IDB, and here are the results sorted by similarity:
Bindiff results between 12.4.8 and 12.4.9 kernels
These results are beyond all expectations! There are only 8 functions slightly changing between the two versions, all in the kernel!
Among these 8 results, 2 are actually minor instructions ordering changes. In the 6 remaining ones, 5 of them have an added call to bzero, which make them the perfect candidates for a memory leak vulnerability involving a "memory initialization issue" :)
Added bzero call
iOS kernelcaches usually lack symbols, but some entry points such as mach traps can be easily identified, using e.g. joker tool. Debug strings along with public XNU sources also allow renaming many functions, and we could identify the 5 patched functions as:
mach_msg_send
mach_msg_overwrite
ipc_kmsg_get
ipc_kmsg_get_from_kernel
ipc_kobject_server
All these functions deal with ipc_kmsg objects. kmsg objects are the kernel representation of mach messages and are a complex aggregate of structures. Looking at the source code of these functions, the bzero call can be linked to the initialization of kmsg trailers.
Down the ipc_kmsg trailer rabbit hole
Trailers are structures with a dynamic size depending on their type. The tiniest trailer is an 8-bytes structure containing nothing but the type and size, whereas the biggest one is 0x44 bytes long and has several fields, as seen in the following extract from XNU source code:
When creating a new kmsg, the kernel does not know yet which trailer type will be requested when receiving the message. It thus reserves the biggest size, initializes some fields, and sets the type to the smallest one. For example, the trailer initialization in ipc_kmsg_get is:
/*
 * I reserve for the trailer the largest space (MAX_TRAILER_SIZE)
 * However, the internal size field of the trailer (msgh_trailer_size)
 * is initialized to the minimum (sizeof(mach_msg_trailer_t)), to optimize
 * the cases where no implicit data is requested.
 */
trailer = (mach_msg_max_trailer_t *) ((vm_offset_t)kmsg->ikm_header + size);
trailer->msgh_sender = current_thread()->task->sec_token;
trailer->msgh_audit = current_thread()->task->audit_token;
trailer->msgh_trailer_type = MACH_MSG_TRAILER_FORMAT_0;
trailer->msgh_trailer_size = MACH_MSG_TRAILER_MINIMUM_SIZE;
[...]
trailer->msgh_labels.sender = 0;
This looks interesting! If we're able to read a mach message asking for a longer trailer than expected, we might retrieve uninitialized chunks of memory.
When reading a mach message using mach_msg(), the execution flow in kernel-land to reach the trailer copyout is:
mach_msg_trap
mach_msg_overwrite_trap
mach_msg_receive_results
ipc_kmsg_add_trailer
In ipc_kmsg_add_trailer(), the output trailer size is calculated:
mach_msg_trailer_size_tipc_kmsg_add_trailer(ipc_kmsg_t kmsg, ipc_space_t space __unused,
mach_msg_option_t option, thread_t thread,
mach_port_seqno_t seqno, boolean_t minimal_trailer,
mach_vm_offset_t context){
mach_msg_max_trailer_t *trailer;
#ifdef __arm64__mach_msg_max_trailer_t tmp_trailer; /* This accommodates U64, and we'll munge */ [1]
void *real_trailer_out = (void*)(mach_msg_max_trailer_t *)
((vm_offset_t)kmsg->ikm_header +
mach_round_msg(kmsg->ikm_header->msgh_size));
/*
* Populate scratch with initial values set up at message allocation time.
* After, we reinterpret the space in the message as the right type
* of trailer for the address space in question.
*/
bcopy(real_trailer_out, &tmp_trailer, MAX_TRAILER_SIZE); [2]
trailer = &tmp_trailer;
#else/* __arm64__ */
(void)thread;
trailer = (mach_msg_max_trailer_t *)
((vm_offset_t)kmsg->ikm_header +
mach_round_msg(kmsg->ikm_header->msgh_size));
#endif/* __arm64__ */if (!(option & MACH_RCV_TRAILER_MASK)) { [3]
return trailer->msgh_trailer_size;
}
trailer->msgh_seqno = seqno;
trailer->msgh_context = context;
trailer->msgh_trailer_size = REQUESTED_TRAILER_SIZE(thread_is_64bit_addr(thread), option); [4]
[...]
In [1], a new trailer is used on the stack.
In [2], the kmsg trailer content is copied in the new trailer.
In [3], option argument is checked against MACH_RCV_TRAILER_MASK. This option parameter comes from the option parameter passed to mach_msg() in userland.
In [4], the real trailer size is calculated using macro REQUESTED_TRAILER_SIZE().
By providing an option matching MACH_RCV_TRAILER_MASK to mach_msg(), we can ask the kernel to return a specific trailer size. The supported options are defined in message.h:
Thus, we can call mach_msg() with e.g. MACH_RCV_TRAILER_ELEMENTS(MACH_RCV_TRAILER_AUDIT) in the option parameter to request a specific trailer size. Now, what happens in ipc_kmsg_add_trailer() when requesting a trailer bigger than the initialized one? In ipc_kmsg_get(), we saw that only msgh_sender, msgh_audit and msgh_labels optional fields were initialized, leaving 3 fields uninitialized.
[...]
trailer->msgh_seqno = seqno; [1]
trailer->msgh_context = context;
trailer->msgh_trailer_size = REQUESTED_TRAILER_SIZE(thread_is_64bit_addr(thread), option);
if (minimal_trailer) { [2]
goto done;
}
if (GET_RCV_ELEMENTS(option) >= MACH_RCV_TRAILER_AV) { [3]
trailer->msgh_ad = 0;
}
/*
* The ipc_kmsg_t holds a reference to the label of a label
* handle, not the port. We must get a reference to the port
* and a send right to copyout to the receiver.
*/if (option & MACH_RCV_TRAILER_ELEMENTS(MACH_RCV_TRAILER_LABELS)) {
trailer->msgh_labels.sender = 0;
}
done:
#ifdef __arm64__
ipc_kmsg_munge_trailer(trailer, real_trailer_out, thread_is_64bit_addr(thread)); [4]
#endif/* __arm64__ */return trailer->msgh_trailer_size;
}
In [1], msgh_seqno and msgh_context are initialized in the trailer copy.
In [2], a boolean passed to the function is checked to return early. This boolean is false when called from mach_msg_receive_results().
In [3], the function checks if the option passed is greater or equal than MACH_RCV_TRAILER_AV, meaning that we want to retrieve a structure containing at least msgh_ad. If this is the case, msgh_ad is initialized to 0 in the trailer copy.
In [4], finally, ipc_kmsg_munge_trailer() copies back the msgh_seqno, msgh_context, msgh_trailer_size and msgh_ad from the trailer copy to the original trailer.
A high level observation does not reveal any bug here, all the fields seem to have been correctly initialized before being returned to userland. However, let's have a look at how the trailer size is really computed by the REQUESTED_TRAILER_SIZE() macro:
This macro returns the correct size when the option value is known, and the maximum size when it is not. This means that by setting a non-existent option lower than MACH_RCV_TRAILER_AV, we can skip the msgh_ad field initialization, while still recovering the biggest possible trailer. This bug is made possible by the fact that values 5 and 6 are not valid MACH_RCV_TRAILER_XXX definitions!
To illustrate this behavior, we can write a simple proof of concept reading a known value from uninitialized memory. In iOS before 13.x, pipe buffers and ipc_kmsg can be allocated in the same kalloc area, as there is no separated heaps before iOS 14. Thus, we can create a pipe buffer filled with a known value (in e.g. kalloc.1024 zone), free it, then send a mach message which size will make it also allocated in kalloc.1024, and finally trigger the vulnerability to read back the known value. Here is the code (github link):
The PoC produces the following output, effectively leaking our magic controlled value:
$ ./CVE-2020-27950_poc
[+] Allocating controlled(magic value 416e7953) kalloc.1024 buffer
[+] Creating kalloc.1024 ipc_kmsg
[+] Freeing controlled buffer
[+] Sending message
[+] Now reading message back
[+] Leaked value: 416e7953
What about leaking a nice kernel pointer?
Leaking a known value proves the vulnerability existence. However, using it to reliably leak an interesting value is usually harder.
An interesting feature of mach messages is their ability to transport mach port rights. When sending a port right, the mach_msg_port_descriptor_t structure is used:
typedefstruct{mach_port_t name;
#if !(defined(KERNEL) && defined(__LP64__))// Pad to 8 bytes everywhere except the K64 kernel where mach_port_t is 8 bytesmach_msg_size_t pad1;
#endifunsignedint pad2 : 16;
mach_msg_type_name_t disposition : 8;
mach_msg_descriptor_type_t type : 8;
#if defined(KERNEL)uint32_t pad_end;
#endif
} mach_msg_port_descriptor_t;
This structure is different when used in userland or kernel. Indeed, in userland mach_port_t is defined as an unsigned int (an opaque value identifying a port) whereas it is defined to a struct ipc_port pointer in kernel.
This difference means that a mach message sent with multiple mach_msg_port_descriptor_t structures will result in a kernel ipc_kmsg structure containing multiple pointers to ports. Thus, we're able to put interesting data in a kernel buffer we might be able to leak later!
The trick to be able to read part of ipc_port pointers is to send a first message containing X mach_msg_port_descriptor_t, free it, and send another message with X-Y mach_msg_port_descriptor_t, so the allocation is reused and its trailer is written where the previous message descriptors were laying. The number of descriptors sent have to be adjusted to fulfill 2 conditions:
the ipc_kmsg allocations should be made in the same kalloc zone ;
the difference between X and X-Y descriptors should be sufficient to shift the trailer earlier in the buffer so that it overlaps some previous message descriptors.
In practice, sending 50 descriptors in the first message and 40 descriptors in the second one fulfill the conditions. As the vulnerability only allows leaking 4 bytes of memory, we also need to shift the trailer by steps of 4 bytes. Luckily, we're able to send some padding in a mach message without triggering any problem (as long as we pad with multiples of 4 bytes), allowing us to efficiently shift our leak window.
We still have one step to complete: being able to free the ipc_kmsg buffer containing the kernel pointer. If we try to read the message normally, the pointers will be replaced by the userland mach name before being copied back to userland. We thus have to trigger an error to simply free the allocation without triggering this behavior.
Here is the final exploit leaking a kernel ipc_port address (github link):
The exploit should produce the following output when executed on iOS prior to 14.2:
$ ./CVE-2020-27950_leak_port
[*] Will get port 1203 address
[*] Creating first kalloc.1024 ipc_kmsg
[*] Creating second kalloc.1024 ipc_kmsg
[*] Sending message 1
[*] Discarding message 1
[*] Sending message 2
[*] Reading back message 2
[*] Sending message 3
[*] Discarding message 3
[*] Sending message 4
[*] Reading back message 4
[+] Port 1203 has address FFFFFFE1A1A975D0
Conclusion
In this blogpost, we investigated a patched iOS kernel to retrieve details about a patched kernel memory leak vulnerability. We identified the root cause, wrote a simple PoC and found a method to reliably get a mach port kernel address. It's quite surprising how long this vulnerability has survived in XNU knowing that the code is open source and heavily audited by hundreds of hackers.
The attentive reader would have noticed that we didn't detail the other patched vulnerability, identified as a type confusion by Apple. While the fix is quite easy to find with bindiff, its analysis is not so trivial, and might be the subject of a future blogpost if we get enough time to dig into!
About the Author
Fabien Perigaud is the Reverse Engineering team technical leader at Synacktiv.
Why you should marry threat hunting and risk assessment.
by Roland Gharfine

“My most brilliant achievement was my ability to be able to persuade my wife to marry me.” - Winston Churchill
I have successfully verified a quote with absolute certainty for the second week in a row, please congratulate me in the comments.
Welcome to today's marriage counseling session, I am your host for the day, Roland Gharfine. Today, we won't try to persuade the couple to marry, as they are already in love and feel ready to tie the knot. We shall instead try to convince the <insert your preferred authority here> to marry them. You'll see what I mean in a minute, or twelve.
Before we get started on our strongly opinionated journey, I'd like to tell you a little bit about me and about what I do first.
It may surprise you that I am not in fact a marriage counselor. I know, hold on to your hats. I'm a hybrid between a CISO and a security engineer, and I've had the good fortune of molding a company's security framework in an almost single-handed manner. In short, for the past 6 years, if it had to do with security, whether operations, strategy or policy, I had my hand in it. I have some other qualifications that may not be strictly relevant to the conversation, but feel free to check out my LinkedIn profile if you're curious.
Onto the subject matter. Threat hunting has been the rising star of the past 5 years, and even the term "rising star" might be an understatement. According to this source, 82% of SOCs (security operation centers) are investing heavily in threat hunting programs. Although we tend to hate buzzwords in this counseling practice, we shall discuss this one and explain its importance anyway.
In this article, we will try to disambiguate yet another concept, discuss the best ways to implement it, and provide our opinion on where it should fit in when it comes to the big picture of an organization's security strategy.
What is this threat hunting everyone keeps banging on about?
The short answer is: not a buzzword. Threat hunting is an indisputable sign of process and framework maturity (if it's done right).
The longer answer is not that simple, but in the usual spirit of disambiguation, we will try to bring it closer to home. In a nutshell, threat hunting is the proactive habit of looking for soft spots and anomalies around your assets, you know, what us cool kids call "vulnerabilities". This is not to say that threat hunting and vulnerability assessment are the same, because they are not.
Threat hunting goes deeper, involves trend awareness, and has a lot of facets to it. If threat hunting were a person, it would be a really interesting and sophisticated individual.
Instead of implementing your security controls and happily sitting idle, you will instead challenge your own design. You'll make use of threat hunting to implement a principle which is quite popular in software testing: The absence of error fallacy.
I won't delve into the principle itself (though I might in the future given my dual background), but I will say this: This is a clear sign of how perspective can nurture your organization's security stance. I discussed that in detail in this article.
That shameless plug aside, let's provide a (hopefully) useful analogy.
Think of it this way: if your security team is law enforcement, security controls are your cameras, officers and their training, laws and processes, awareness campaigns for public safety, and all that jazz.
On the other hand, threat hunting would be like deploying patrols. This is necessary, for all the policies and measures in the world are not enough to mitigate the risk of a criminal acting on vulnerable citizens or property, and exploiting the situation for one intent or another, which is why you continuously monitor, assess, test hypotheses, and challenge your own vision about the level of security in your town or area.
Your patrols will operate on certain protocols, have investigation mechanisms, and are supported by certain technologies. So will your threat hunters.
Why should anyone care anyway?
You might be thinking, "I'm perfectly fine as is, my team is performing well, and I don't even feel the need to change anything about how we work". That's a completely understandable sentiment, and a fair point, but allow me to explain something before you make the decision to shrug me off. First of all, although I absolutely hate trends and don't take most of them seriously, this is an exception to the rule. Threat hunting is not just a trend, it's increasingly popular for a reason, which is a breath of fresh air in cybersecurity as far as I'm concerned. At any rate, I will try to present to you the non-technical arguments for implementing threat hunting and introducing this type of program into your process.
Reason #1: Internal audits don't cover enough details, and are subject to conflicts of interest. It's inevitable, we are as biased as we are human. Even your most supremely skilled auditors cannot cover the human element of risks perfectly, as their observations will be limited and they will be weighed down to an extent by their interpersonal relationships. While there might be automated reports about technical controls, and while those reports will produce numbers that do not lie, this is by no means a complete coverage of your threat universe.
Reason #2: External audits are not frequent enough, and end up falling short of providing a true assessment of where you stand against a real life attack. Sure, audits will tell you a lot about your process, and will often make use of a sampling approach to tell you where you stand on a significant portion of subjects. However, they usually occur once a year, and this level of frequency is an issue: a year is an eternity in the world of cybersecurity. They will also not simulate a real attack by any stretch of the imagination. They often rely on interviews, and will focus on process over minute technical details. External audits lack the granularity to pick up on the minute details which threat hunting targets, and that is the reason why you will often get disclaimers from the accreditation boards that a successful audit does not guarantee a fully compliant stance 100% of the time.
Reason #3: The growing fluidity and persistence of attacks. Once someone has found a way into your network or infrastructure, they tend to stay for as long as they can. If they were just doing target practice, they would use hackthebox. Instead, they are trying to achieve a ROI of their own, and will try anything to remain hidden and keep the initial foothold they got. You must set out to find them with the assumption that they are there.
Watch out for the red flags
Just like any marriage, a failed one will have shown obvious red flags from the beginning, or perhaps even before it began. You might see that shiny term, "threat hunting", and think of how dreamy it is, and how much you'd like to put a ring on it.
But be careful, going through with the new relationship might end up leaving you disappointed, unless you pay attention and keep an eye out for those red flags.
When you find your threat hunting is just glorified improvisation, and you find yourself pushing your team to jump onto bandwagons and you only pay attention to recent trends, you might want to reconsider your approach.
When you find your threat hunting is an isolated silo which doesn't connect back to other processes, you really really want to reconsider your approach. More on this particular thought later.
In short, ad-libbing, chaos, lack of a coherent strategic vision, unplanned roll-outs, and more... all of those will kill your process maturity, and constitute red flags that you always need to pay attention to, especially with the entangled web of topics and skills that is threat hunting. If you have those problems, fix them first, and then consider introducing this concept to your practices.
I'm no counselor, but psychology plays a big part
We don't often realize how interconnected we are with our technology. Stop and think about it for a second, and I mean really think about it. You can't separate psychology from cyber attacks, otherwise you wouldn't bother studying social engineering techniques, and trying to immunize your organization's staff against them.
You also can't separate leadership traits from the maturity level of a security framework. Without sound leadership, you are stuck putting out fires and will never reach a sustainable security stance.
A relevant question of our time: Would you rather eliminate one disease 100%, or mitigate every disease up to 80%?
This is a textbook example of our recency bias and of our human impulses.
I bet most of you would answer the above question this way: "I would allocate every resource to fight against COVID-19 and eradicate it". I get it, I've been on lockdown too, and though I'm lucky to be able to make a living while I'm safe at home, I've also seen what people have suffered recently, so I sympathize with the sentiment.
However, succumbing to impulses and biases is a monumental mistake. In reality, you are much better served when you try to systematically monitor and reduce all risks, not just focus on the latest trends, which is one of our red flags for the newly formed relationship.
Not only did you set yourself up for failure by announcing the unrealistic target of completely eradicating a threat (absence of error fallacy, remember?), but you have also left yourself vulnerable by ignoring other threats. Anything you neglect about your strategy will become weaker over time, and you are only as strong as your weakest link!
You can already sense that I'm hinting at the biggest point of this argument, how this whole thing fits in with risk assessment and other pillars of your process. More on that shortly.
There is no magic wand here, you must take ownership and fight against those impulses as a cybersecurity leader of your organization. I sound like a broken record by now, but remember: strategy first, tactical adjustments second.
The power you wield when you do things right
So how does this fit into the bigger picture for an organization? How do you implement it, and what would be the benefits?
Well, almost everything I've said so far leads to this, the crux of our argument. You absolutely shouldn't implement threat hunting as an isolated process and an information silo. Threat hunting should link to many processes, from risk assessment, to training programs, to internal audit methodologies and frequencies.
When you link your threat hunting to your risk assessment, you have rationalized your approach, and escaped the relentless chase of trends. When you bolster both your risk assessment and threat hunting with a solid threat modeling methodology, you have managed to not let the fight against recency bias forbid you from monitoring the landscape for trends, because you shouldn't eliminate that entirely at all.
This is like making solid financial and logistical plans for your wedding. By understanding what is most likely to go wrong, you can identify what scenarios must be most thoroughly considered, and you will end up with better results. True for life, and true for cybersecurity.
Moreover, when you link your threat hunting, risk assessment, skill gap analysis, hiring strategy, asset inventories, the philosophy behind your system, and your own leadership style all together, you gain complete control of the process and you reap benefits beyond your imagination. Don't be afraid, it's never too late to strategize.
You MUST understand the "Why" and the "How" behind what you're doing!
If you don't, you will never achieve much beyond loosely defined measures and an unsustainable security stance. This is especially relevant for threat monitoring and hunting.
Being a cybersecurity leader in your organization mandates an unrivaled level of understanding for this purpose (the Why) and those methods (the How). Monitoring threats and especially the human side of them is not about sharing articles discussing the latest attacks. If you understand that having idle security measures is not enough, and that you need to be proactive, you have understood your Why. If you cultivate your specialists' skills and cultivate your knowledge base of techniques and best practices, you have understood your How. The point is, threat hunting is never step 1.
Threat hunting is not a buzzword (well, not just a buzzword), it's part of your "thoughtful design" for your organization's strategy. If your approaches are not coherent, your problems are bigger than just ransomware.
Mind the (skill) gap
The minute details of how you implement a threat hunting program are also important. You need to assess your own team for skill gaps before your innovation train can charge through and reach the platform. While continuous skill gap analysis is recommended and vital for any security team, this is especially relevant for threat hunting, so much so that I think it deserves to be pointed out separately. Why is that? Well, in simple terms, technical expertise is of the essence when you realize that you are implementing threat hunting to detect what even automated solutions cannot. You need technical experts with an extremely sharp eye for detail, specific knowledge of exploits and the technologies they are targeting, and the ability to recommend a solution to the problems they found.
This is only the first side of my argument, but you might already be asking: How is this skill set different from any ethical hacker's, auditor's, or even any software tester's? The truth is, if external penetration testing exercises did the trick, threat hunting would not be so popular. Again, threat hunting goes deeper, investigates so many scenarios that would not be covered by your once-in-a-while-penetration-testing-exercise, and investigates specific threats that are not easily picked up by an external actor. You might think I could have just said "Zero-day vulnerabilities", but 1) Disambiguation, and hence no technical buzzwords, and 2) It is about those, but also about much more.
On the other hand, there's a much more complicated side of a threat hunter's skill set to consider: their soft skills. A threat hunter needs to be a special blend of instinct, communication, persistence, and knowledge. You must choose specific characters that are from a specific mold.
In short, in order to implement an effective program, make sure your current human resources have the necessary skills.
For further counseling, contact my practice
Thank you for attending today's therapy session. and I do sincerely hope that you are benefiting from my posts, and most of all, enjoying them. In the spirit of group therapy, please do not hesitate to express your thoughts and feelings, and contact me with suggestions, criticism, rebuttals, or even questions if you think you or your organization could use my experience and opinions. Just saying hi is once more (and forever will be) perfectly fine as well. Also, find my posts on the hashtag #askroland which I've recently launched. I just enjoy smart discussions, and I hope you and I can have them.
Send me a message or connection request, comment below, or communicate in any way if you feel like it (contact info available in my profile). I'm just impressed that you made it this far, and would like to virtually shake your hand. For now, I'm afraid our session is over. See you next week.
Good luck, and keep on keeping on.
About the Author
Roland Gharfine - Cybersecurity Engineer | Consultant | Test Automation Specialist | CISSP | CEH | ISTQB Certified Test Automation Engineer
Chrome may be slowing down your Mac - here's how to delete it entirely
by William Gallagher
As popular as it is, Chrome causes problems on Macs. If you're having difficulties with your Mac running slowly, Chrome update routines and support libraries may be the culprit — again. Here's how to uninstall it, and remove all the files Google keeps on your drive.
If you ever have any problem with any online service at all, the first thing their support desk will tell you is to switch to Google Chrome. It's not the solution, though, it's just presumably their favorite browser — and they, it seems, are not using Macs.
That's because if they were, there's a strong chance they'd be getting pretty weary themselves of just what a bad Mac citizen Google Chrome is. Not everyone gets any problems from Chrome, but tell that to Hollywood's Avid editors who found their Macs shutting down because of it.
Or tell it to the unnamed Mac user who got so frustrated that he or she set up a website called Chrome is Bad. As well as briefly outlining how unfathomably slow various Macs were running, the site details how to get rid of Chrome entirely.
There is more to it than just removing the application. Google installs various files that don't deleted when you trash Chrome. But, still, deleting Chrome and switching to an alternative is where you start
How to remove the Chrome application
Drag Google Chrome from Applications to the Trash
Restart your Mac
Utilities like Hazel will remove some Chrome files, but even these won't get everything.
If you use the utility app Hazel, then once you drag Chrome to the bin, it will prompt you to remove more. Hazel finds files that are linked to an application and asks if you want to delete those too.
Delete them, but unfortunately you're still not done. This is one reason why the "Chrome is Bad" site author is particularly angry.
"Google Chrome installs something called Keystone on your computer," says the site, "which nefariously hides itself from Activity Monitor and makes your whole computer slow even when Chrome isn't running."
The Keystone files survive even Hazel's automated systems, so you have to delete them yourself.
How to purge Chrome from your Mac
Click the Go menu in the Finder or press Command-Shift-G
In the dialog box that appears, type /Library (the / is important)
Go through five different folders, starting with LaunchAgents, and remove any Google folders
Do the same with the LaunchDaemons, Application Support, Caches, and Preferences folders
Also remove any files that begin with either com.google or com.google.keystone
Again click the Go menu in the Finder or press Command-Shift-G
This time, type ~/Library into the box (and the ~ is crucial))
Go through the same five folders, starting again with LaunchAgents, and remove any Google folders
Do the same with the LaunchDaemons, Application Support, Caches, and Preferences folders
Again, also remove any com.google or com.google.keystone files
Empty the trash
Restart your Mac
You may find that you don't have all of these folders, or that some won't have any com.google files. Just remove any you do find.
Note that you will be prompted to enter your password every single time you delete anything from this Library, but it's worth it.
Depending on your Mac, you may notice Google folders that don't appear to have any connection with Chrome, and don't have the word Keystone anywhere. Delete them anyway.
Keystone was first introduced with Google Earth over a decade ago, and caused problems then, so it's not specific to just Chrome. If you run Google Earth, or any other Google app whose files and folders you just deleted, it will recreate the ones it needs to run.
Again, not everyone gets this problem. It's rare enough that it gets disputed, yet common enough that it's worth removing Keystone to try it out.
Google has not directly commented on the launch of the "Chrome is Bad" site. Separately, it has announced a version of Chrome for Apple Silicon which it claims reduces CPU usage, and battery life.
About the Author
William Gallagher is a writer on AppleInsider and is Deputy Chair of the Writers ’Guild. He runs the Room 204 Buddying Program, writes Doctor Who radio dramas and is the author of 19 non-fiction books including the British Film Institute's BFI TV Classics: The Beiderbecke Affair. He's previously written extensively for Radio Times, BBC Ceefax and BBC News Online. His first collection of short stories is due to be published in 2020. He once had afternoon tea on a Russian nuclear submarine and regrets calling the place a dive.
The short story of broken KRETPROBES and OPTIMIZER in Linux Kernel.
by Adam Zabrocki
During the LKRG development process I’ve found that:
KRETPROBES are broken since kernel 5.8 (fixed in upcoming kernel)
OPTIMIZER was not doing sufficient job since kernel 5.5
First things first – KPROBES and FTRACE:
Linux kernel provides 2 amazing frameworks for hooking – K*ROBES and FTRACE. K*PROBES is older and a classic one – introduced in 2.6.9 (October 2004). However, FTRACE is a newer interface and might have smaller overhead comparing to K*PROBES. I’m using a word “K*PROBES” because various types of K*PROBES were availble in the kernel, including JPROBES, KRETPROBES or classic KPROBES. K*PROBES essentially enables the possibility to dynamically break into any kernel routine. What are the differences between various K*PROBES?
KPROBES – can be placed on virtually any instruction in the kernel
JPROBES – were implemented using KPROBES. The main idea behind JPROBES was to employ a simple mirroring principle to allow seamless access to the probed function’s arguments. However, since 2017 JPROBEs were depreciated. More information can be found here: https://lwn.net/Articles/735667/
KRETPROBES – sometimes they are called “return probes” and they also use KPROBES under-the-hood. KRETPROBES allows to easily execute user’s own routine at the entry and return path to the hooked function.However, KRETPROBES can’t be placed on arbitrary instructions.
When a KPROBE is registered, it makes a copy of the probed instruction and replaces the first byte(s) of the probed instruction with a breakpoint instruction (e.g., int3 on i386 and x86_64).
FTRACE are newer comparing to K*PROBES and were initially introduced in kernel 2.6.27, which was released on October 9, 2008. FTRACE works completely differently and the main idea is based on instrumenting every compiled function (injecting a “long-NOP” instruction – GCC’s option “-pg”). When FTRACE is being registered on the specific function, such “long-NOP” is being replaced with JUMP instruction which points to the trampoline code. Later such trampoline can execute any pre-registered user-defined hook.
A few words about Linux Kernel Runtime Guard (LKRG)
In short, LKRG performs runtime integrity checking of the Linux kernel (similar to PatchGuard technology from Microsoft) and detection of the various exploits against the kernel. LKRG attempts to post-detect and promptly respond to unauthorized modifications to the running Linux kernel (system integrity) or to corruption of the task integrity such as credentials (user/group IDs), SECCOMP/sandbox rules, namespaces, and more. To be able to implement such functionality, LKRG must place various hooks in the kernel. KRETPROBES are used to fulfill that requirement.
LKRG’s KPROBE on FTRACE instrumented functions
A careful reader might ask an interesting question: what will happen if the function is instrumented by the FTRACE (injected “long-NOP”) and someone registers K*PROBES on it? Does dynamically registered FTRACE “overwrite” K*PROBES installed on that function and vice versa?
Well, this is a very common situation from LKRG’s perspective, since it is placing KRETPROBES on many syscalls. Linux kernel uses a special type of K*PROBES in such case and it is called “FTRACE-based KPROBES”. Essentially, such special KPROBE is using FTRACE infrastructure and has very little to do with KPROBES itself. That’s interesting because it is also subject to FTRACE rules e.g. if you disable FTRACE infrastructure, such special KPROBE won’t work either.
OPTIMIZER
Linux kernel developers went one step forward and they aggressively “optimize” all K*PROBES to use FTRACE instead. The main reason behind that is performance – FTRACE has smaller overhead. If for any reason such KPROBE can’t be optimized, then classic old-school KPROBES infrastructure is used.
When you analyze all KRETPROBES placed by LKRG, you will realize that on modern kernels all of them are being converted to some type of FTRACE
LKRG reports False Positives
After such a long introduction finally, we can move on to the topic of this article. Vitaly Chikunov from ALT Linux reported that when he runs FTRACE stress tester, LKRG reports corruption of .text section:
I spent a few weeks (month+) on making LKRG detect and accept authorized third-party modifications to the kernel’s code placed via FTRACE. When I finally finished that work, I realized that additionally, I need to protect the global FTRACE knob (sysctl kernel.ftrace_enabled), which allows root to completely disable FTRACE on a running system. Otherwise, LKRG’s hooks might be unknowingly disabled, which not only disables its protections (kind of OK under a threat model where we trust host root), but may also lead to false positives (as without the hooks LKRG wouldn’t know which modifications are legitimate). I’ve added that functionality, and everything was working fine… … until kernel 5.9. This completely surprised me. I’ve not seen any significant changes between 5.8.x and 5.9.x in FTRACE logic. I spent some time on that and finally I realized that my protection of global FTRACE knob stopped working on latest kernels (since 5.9). However, this code was not changed between kernel 5.8.x and 5.9.x. What’s the mystery?
if (user_mode(regs)) {
    RCU_LOCKDEP_WARN(!rcu_is_watching(), "entry code didn't wake RCU");
} else {
    /*
     * We might have interrupted pretty much anything.  In
     * fact, if we're a machine check, we can even interrupt
     * NMI processing.  We don't want in_nmi() to return true,
     * but we need to notify RCU.
     */
    rcu_nmi_enter();
}

preempt_disable();
/*
 * idtentry_enter_user() uses static_branch_{,un}likely() and therefore
 * can trigger INT3, hence poke_int3_handler() must be done
 * before. If the entry came from kernel mode, then use nmi_enter()
 * because the INT3 could have been hit in any context including
 * NMI.
 */
if (user_mode(regs)) {
    idtentry_enter_user(regs);
    instrumentation_begin();
    do_int3_user(regs);
    instrumentation_end();
    idtentry_exit_user(regs);
} else {
    nmi_enter();
    instrumentation_begin();
    trace_hardirqs_off_finish();
    if (!do_int3(regs))
        die("int3", regs, 0);
    if (regs->flags & X86_EFLAGS_IF)
        trace_hardirqs_on_prepare();
    instrumentation_end();
    nmi_exit();
}
The root of unlucky change comes from this commit:
and this is what we currently have in all kernels since 5.8. Essentially, KRETPROBES are not working since these commits. We have the following logic:
asm_exc_int3() -> exc_int3():
                    |
    ----------------|
    |
    v
...
nmi_enter();
...
if (!do_int3(regs))
       |
  -----|
  |
  v
do_int3() -> kprobe_int3_handler():
                    |
    ----------------|
    |
    v
...
if (!p->pre_handler || !p->pre_handler(p, regs))
                             |
    -------------------------|
    |
    v
...
pre_handler_kretprobe():
...
    if (unlikely(in_nmi())) {
        rp->nmissed++;
        return 0;
    }
Essentially, exc_int3() calls nmi_enter(), and pre_handler_kretprobe() before invoking any registered KPROBE verifies if it is not in NMI via in_nmi() call.
I’ve reported this issue to the maintainers and it was addressed and correctly fixed. These patches are going to be backported to the stable tree (and hopefully to LTS kernels as well):
However, coming back to the original problem with LKRG… I didn’t see any issues with kernel 5.8.x but with 5.9.x. It’s interesting because KRETPROBES were broken in 5.8.x as well. So what’s going on?
As I mentioned at the beginning of the article, K*PROBES are aggressively optimized and converted to FTRACE. In kernel 5.8.x LKRG’s hook was correctly optimized and didn’t use KRETPROBES at all. That’s why I didn’t see any problems with this version. However, for some reasons, such optimization was not possible in kernel 5.9.x. This results in placing classic non-optimized KRETPROBES which we know is broken.
Second problem – OPTIMIZER isn’t doing sufficient job anymore.
I didn’t see any changes in the sources regarding the OPTIMIZER, neither in the hooked function itself. However, when I looked at the generated vmlinux binary, I saw that GCC generated a padding at the end of the hooked function using INT3 opcode:
...
ffffffff8130528b:       41 bd f0 ff ff ff       mov    $0xfffffff0,%r13d
ffffffff81305291:       e9 fe fe ff ff          jmpq   ffffffff81305194
ffffffff81305296:       cc                      int3
ffffffff81305297:       cc                      int3
ffffffff81305298:       cc                      int3
ffffffff81305299:       cc                      int3
ffffffff8130529a:       cc                      int3
ffffffff8130529b:       cc                      int3
ffffffff8130529c:       cc                      int3
ffffffff8130529d:       cc                      int3
ffffffff8130529e:       cc                      int3
ffffffff8130529f:       cc                      int3
Such padding didn’t exist in this function in generated images for older kernels. Nevertheless, such padding is pretty common.
diff --git a/arch/x86/kernel/vmlinux.lds.S b/arch/x86/kernel/vmlinux.lds.S
index b06d6e1188deb..3a1a819da1376 100644
--- a/arch/x86/kernel/vmlinux.lds.S
+++ b/arch/x86/kernel/vmlinux.lds.S
@@ -144,7 +144,7 @@ SECTIONS
 		*(.text.__x86.indirect_thunk)
 		__indirect_thunk_end = .;
 #endif
-	} :text = 0x9090
+	} :text =0xcccc

 	/* End of text section, which should occupy whole number of pages */
 	_etext = .;
It looks like INT3 is now a default padding used by the linker.
I’ve brought up that problem with the Linux kernel developers (KPROBES owners), and Masami Hiramatsu prepared appropriate patch which fixes the problem:
I’ve verified it and now it works well. Thanks to LKRG development work we helped identify and fix two interesting problems in Linux kernel
Thanks, Adam
About the Author
Adam Zabrocki - Principal System Software Engineer (Offensive Security) at NVIDIA, Security Researcher, pentester and bughunter focused on Operating Systems, Reverse engineer and rootkits/virus analyser.
UserAssist — with a pinch of Salt — As an “Evidence of Execution”
by Kirtar Oza
Forensicators use UserAssist keys as an “Evidence of Execution”. UserAssist keys track the execution of any GUI program or application on the system. By analysing UserAssist keys, we can retrieve the name of the application, last execution time and run count for the application. And of course, who executed it as UserAssist keys are a part of the NTUSER.DAT hive.
Lately, I have been experimenting with UserAssist keys on my Windows 10 machine with an OS build 18362. I have seen some interesting observations that I would like to share with you guys.
There are 2 categories of observations.
Type 1 — A program/app is not executed on the system but still it appears under the UserAssist Key. Type 2 — A program/app is executed on the system and it gets registered but with 0 Run Count (and blank “last executed” date in some cases)
We will start with Type 1 as it seems directly questioning the reliability of this artifact as an “Evidence of Execution” and then we will move to Type 2.
Observation 1: Execution gets recorded under UserAssist even if an app/program is not executed
While experimenting with UserAssist keys, I observed a really interesting thing where even if a program/app is not executed on the system; it still gets registered under a UserAssist key by mere opening the path to the shortcut of that specific program/app.
That means, if there is no entry for a specific program/app in the UserAssist key and I open just the path to the shortcut of that program ( and not the program itself) by right clicking on the app icon in the cortona search and clicking on “Open the File Location” option; a new entry will be added to one of the UserAssist keys — {CEBFF5CD-ACE2–4F4F-9178–9926F41749EA} with a Run Count 1 and last execution time populated as appropriately.
If there is already an entry in the UserAssist key for that specific program/app (because of previous executions) then Run Count is incremented by 1 with appropriate last execution time .
This is something completely weird behavior as this will raise doubt on reliability of this artifact as an “Evidence of Execution”.
To explain this behavior, let’s say, I have WinSCP.exe executed once on my system and as an evidence of execution, I found this under UserAssist Key — {CEBFF5CD-ACE2–4F4F-9178–9926F41749EA}.
Figure 1. WinSCP.exe details — Before
You can see here that the WinSCP.exe has been executed on 01/11/2020 at 8:29:24 UTC. The Run Count for the same is 1.
Now, let’s open the path to the WinSCP.exe by right clicking on the shortcut that appears on the Cortona Search and by just opening the path/location to this exe, it will increase the count of the execution (Run Count) in the UserAssist key.
Figure 2. Opening the path to the shortcut of WinSCP.exe through Cortona Search
Figure 3. Path to the shortcut of WinSCP.exe
After this, I have recaptured the NTUSER.DAT to observe the changes in UserAssist.
Figure 4. WinSCP.exe details — After
You can see here that, Run Count of WinSCP.exe has been incremented by 1 ( now Run Count is 2) and the “last execution time” is also updated to 02/11/2020 5:31:41 UTC which is when I opened the path to the shortcut of WinSCP.exe.
You can see here, WinSCP.exe was not run on the machine, we just opened the path to this exe and the Run Count and the execution time is updated under the UserAssist.
Secondly, now, I thought to open the path to the exe/program/app which has no entry at all in my UserAssist and see if by mere opening the path to that exe; we get a new entry in the UserAssist.
I did not have entry for mimikatz.exe in my UserAssist. Moreover, I had total 295 entries under {CEBFF5CD-ACE2–4F4F-9178–9926F41749EA}.
Figure 5. Total Entries (295) under {CEBFF5CD-XX} — Before
Then, I created a shortcut of mimikatz.exe and put it to the folder C:\ProgramData\Microsoft\Windows\Start Menu\Programs and then I follow the same method.
Figure 6. Opening the path to the shortcut of mimikatz.exe through Cortona Search
I did not run the mimikatz.exe I just opened the path where the shortcut of mimikatz.exe is residing.
Figure 7. Path to the shortcut of mimikatz.exe
I recaptured the NTUSER.DAT after this and voila!! I see the entry for mimikatz.exe with Run Count 1 with the last execution date.
Figure 7. mimikatz.exe gets registered even it was not executed
You can see the total entries also has been incremented by 1 (i.e. 296). You can see the entry for mimikatz.exe (original path to exe, not the shortcut) with a Run Count of 1 with the execution date. In reality, I have NOT run mimikatz.exe at all on my system.
This will clearly raise the question on the reliability of this artifact as an “Evidence of Execution”!!
Observation 2: Multiple applications with 0 Run Countand blank “last execution” field
While reviewing UserAssist keys, I came across number of entries with 0 (Zero) Run Count.
Now, that is a strange behavior. How come if a program executed and have a Zero Run Count OR in case, if it is not executed (which justifies 0 Run count) then how come it ended up in UserAsssit keys? Moreover, I observed quite a few entries within the subset of 0 Run Count have not “last execution date” logged.
Following is the summary of my UserAssist key — {CEBFF5CD-ACE2–4F4F-9178–9926F41749EA}
Figure 8. summary of my UserAssist key
As we can see, there are total 295 entries in the UserAssist key — {CEBFF5CD-ACE2–4F4F-9178–9926F41749EA}. Out of these 295 entries, 265 entries are with 0 (Zero) run count. The other observation is that out of 265 with 0 run count, 115 entries do not have the “last execution date” logged whereas 150 entries have them logged.
I have read a research article by @Mathhew Seyer where it has been said that if the app is started automatically (by adding it to the Start Menu\Programs\Startup directory) without user’s manual intervention then it will show up in the UserAssist but the Run Count and Date will not be updated.
This may be true but there has to be other situations/reasons that generate the similar or exact footprints in to the UserAssist key. The reason why I am saying this is there is no apparent reason why 265 programs should have run without user’s intervention. Moreover, there are certain programs, in that list of 265, that I can certainly say that I executed those programs but still they are showing up with Run Count 0.
Figure 9. Snapshot of Programs with 0 Run Count and No dates
Please see the snapshot above of my UserAssist key. Certain entries do not have dates logged where as the programs like notepad.exe, calc.exe, autoruns.exe, livekd64.exe — all of them are executed by me manually multiple times in the past but still they show run count 0.
I have not dug much in to this deeper but this is definitely something strange behavior where the program has been executed but the Run Count is not incremented and Last Date/Time of Execution is not logged (in some cases).
I hope you enjoyed reading this article!! Please share your comments and feedback to me. My contact details are below or you can find me on LinkedIn.
That’s it for now, folks!! Happy hunting, fellas!!