Debugging VisualBasic Malware
Introduction
Reversing malware written in Visual Basic has always been a challenge, or nightmare, as its functionality is totally different from other malware. Malware written in C, C++ (which we mostly see in our day-to-day reversing) mostly gets compiled directly into standard machine instructions that, when we disassemble, are clearly visible. But on the other side, VB compiled malware are not compiled directly into machine instructions, rather a DLL present in the root drive of Windows systems known as MSVBVM60.dll/MSVBVM50.dll interprets the VB program into machine instructions (just like what a JVM does for a Java program). This DLL is always there in the imports of a PE when we have a VB written malware. VB malware basically are compiled in two ways:
1.P-Code or Pseudo Code, which is an intermediate step between high-level instructions and the low-level native code.
2.N-Code or Native Code-Directly into machine instructions.
In this blog we will focus more on Pseudo Code(P-code) compiled binaries, we will:
1.Explore the internals of P-Code.
2.Reverse a VB compiled (P-Code) malware to get more insight on the VB internals.
3.See some old interesting anti-analysis tricks used by recent VB malware.
P-Code Internals
The P-code is a code-compression technology developed by Microsoft that provides the programmers with a flexible and easy-to-implement solution for minimizing an application's memory requirements. P-Code reduces the size of the executable by almost 40%. P-Code, or Pseudo code, consist of RISC (Reduced Set Instruction Set Architecture) like set of instructions to make hardware simpler by using an instruction set composed of a few basic steps for loading and storing operations just like a load command will load data and the store command will store the data.
Note: P-Code is not specific to Visual Basic, C++ also supports it.
Instructions in P-code are much more closely-packed than in assembly because in P-code there is no need to specify source/destination every time for an instruction.
For example, in assembly, for subtraction we write the following mnemonic:
Sub ax, bx
In p-code, this is the same as the above instruction:
SubW
SubW opcode encapsulates both the locations of the operands (on the stack) as well as the stack mechanics.
The above SubW is equivalent to the following assembly sequence:
pop bx ;pop first value from stack to bx
pop ax ;pop second value from stack to ax
Sub ax,bx ;subtract second from first and store the result in ax
Push ax ;push the value back on the stack
Similarly, we have AddW opcode for addition of two register values.
Another example,
pop ax
pop bx
cmp ax,bx
jne 3
The above set of instructions simply means that two values are popped off the stack, then they are compared and if the two values are not equal, a jump of length 3 is taken. P-Code equivalent:
JneW3 or JneWb 03 (b=1 byte)
This is how P-code eliminates the space needed for operands.
Let’s now see through a simple VB compiled (P-Code) program, from the reversing point of view.
We wrote a simple program that simply registers a file in Run key for persistence in the registry; the sample program:
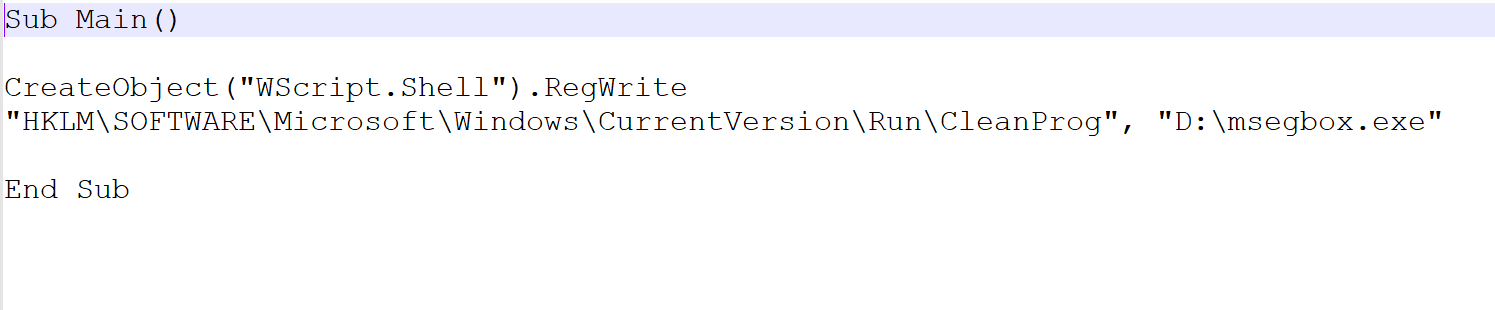
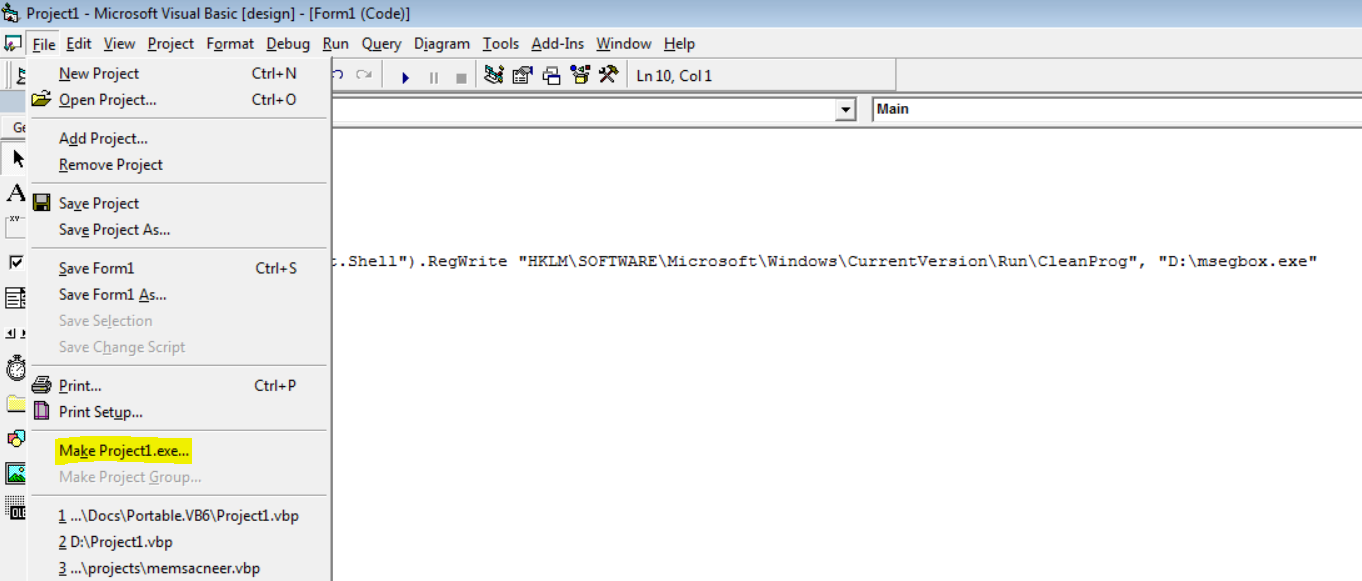
We complied the program in both P-Code and N-code:
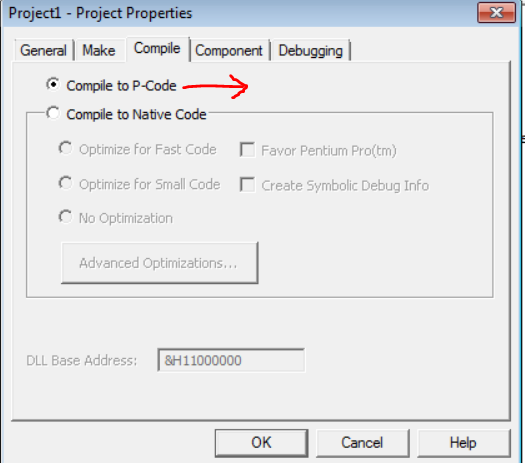
Setting compilation option in properties
Let’s view these in IDA; first let’s view P-Code compiled exe:
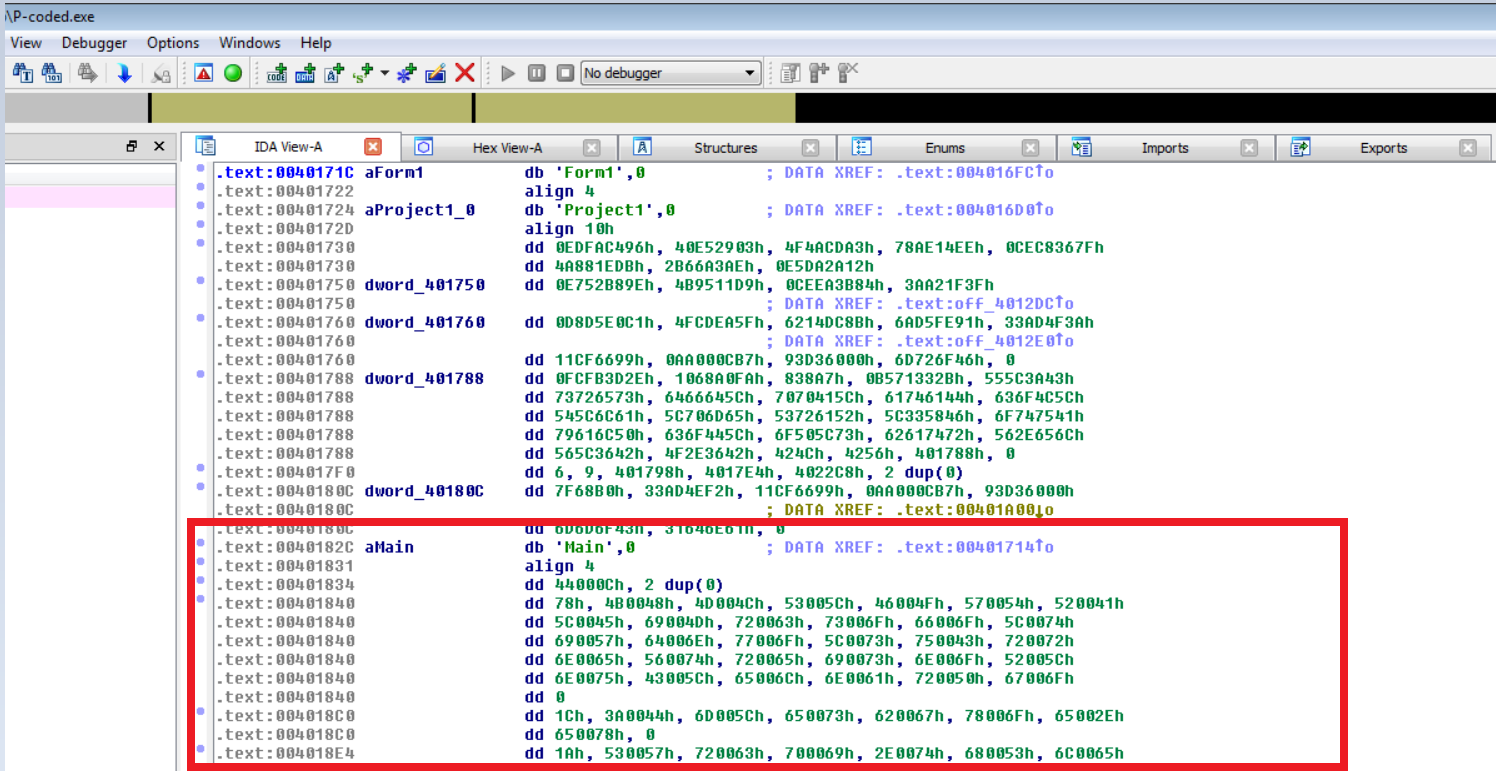
P-Code mnemonics (or intermediate instructions)
N-Code:
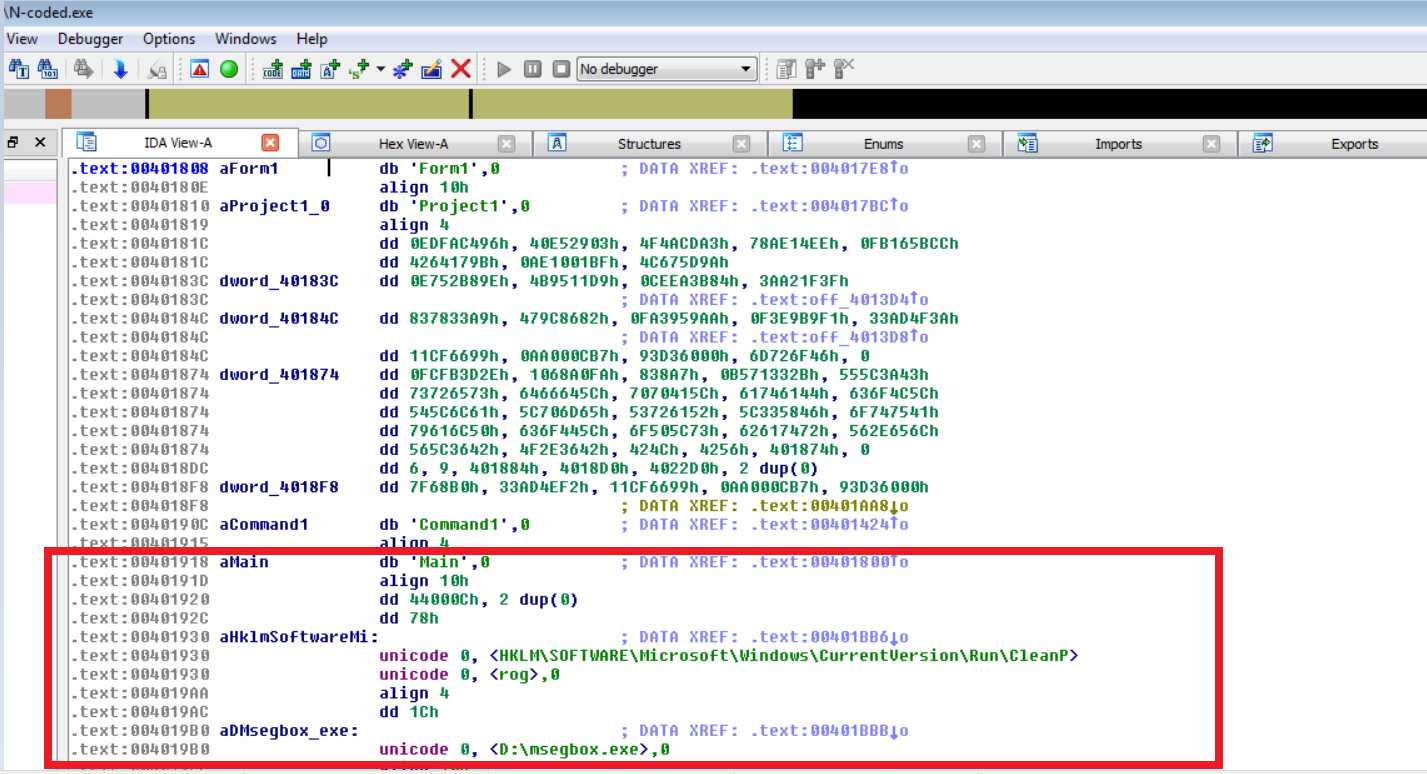
Instructions are clearly visible in this case;D
Generally, what happens is P-Code mnemonics are interpreted by MSVBVM.dll; the below mapping shows an overview of a simple Hello World program:
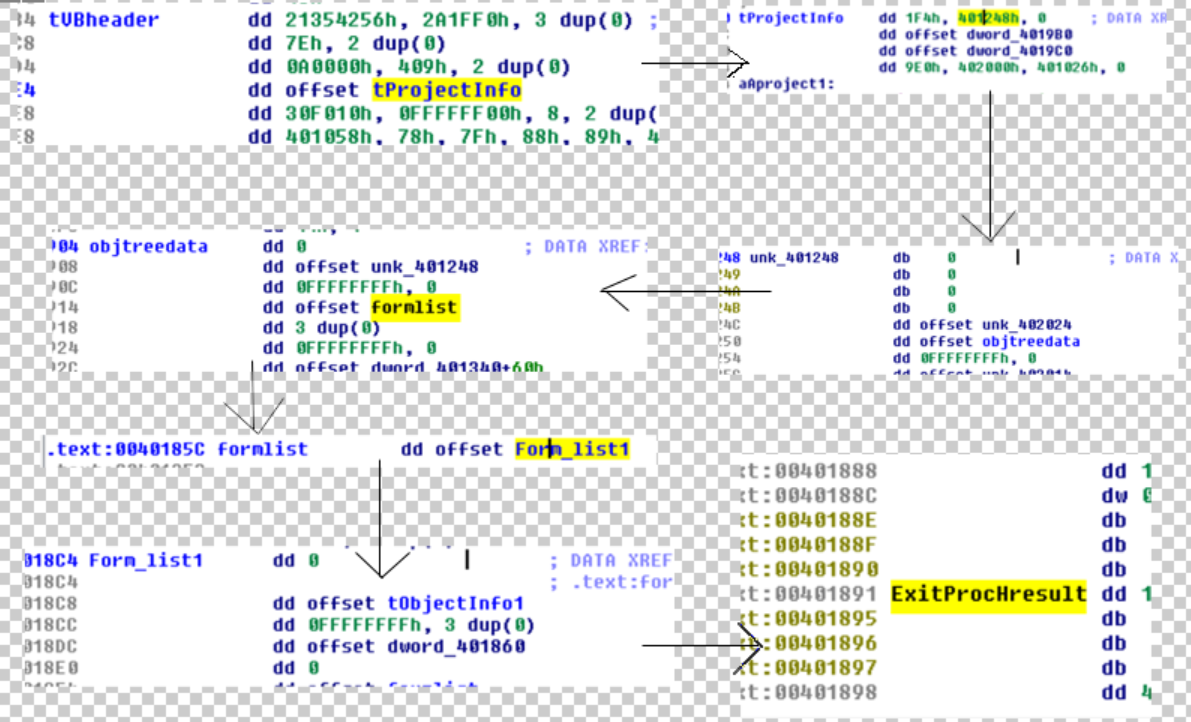
The above image shows the map of the structures used by the loader when the binary gets loaded into the memory and other required set up. Let’s look into VB Header structure.
VB Header
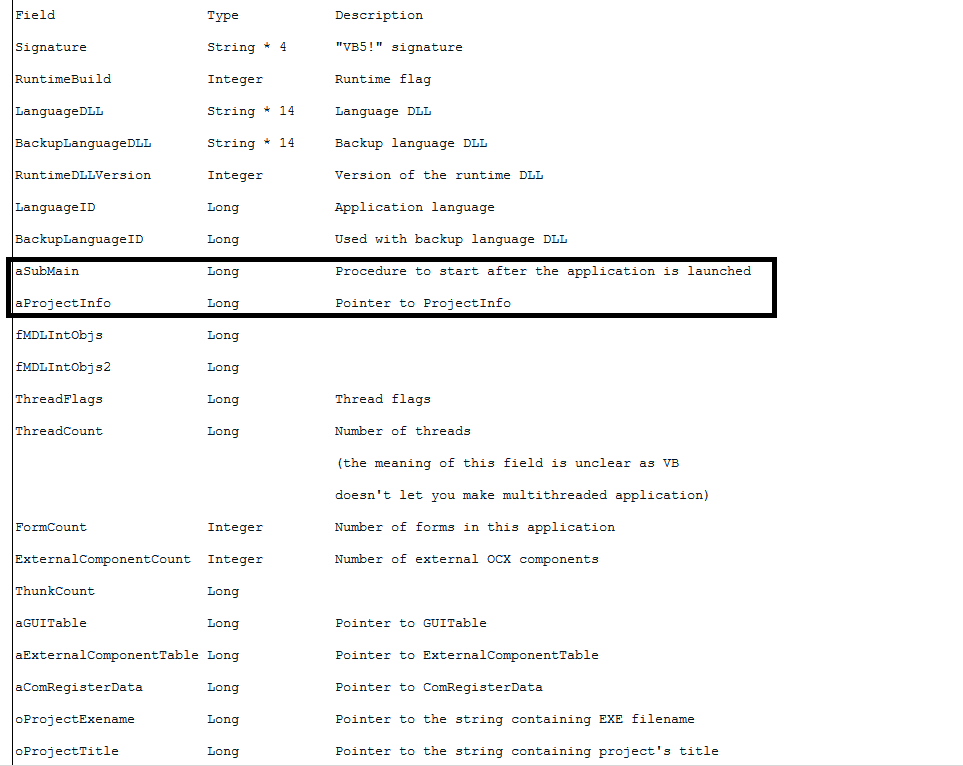
Above are the fields the VB Exe requires while it gets mapped into memory, our fields of interest in the structure above are aSubMain and aProjectInfo. The aSubMain field basically represents the true start of unpacking code whereas aProjectInfo is a structure containing some more fields:
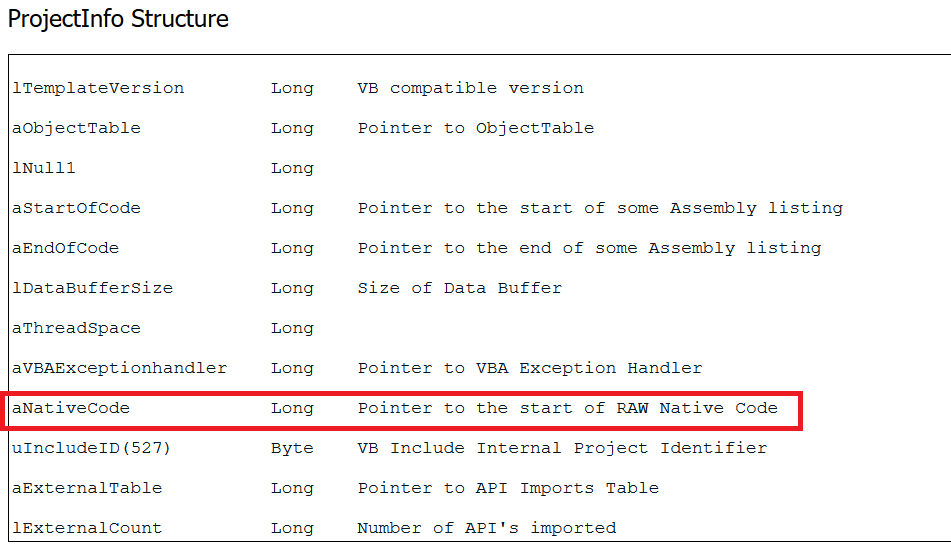
aNativeCode tells us how the Executable has been compiled; if it’s in P-code then aNativeCode is 0, otherwise it’s compiled in N-code (Native Code).
Not only these, there are a lot of fields present in the structures used by the loader. Check the reference section to read more on structures and fields.
Let’s see how the WinAPIs and DLLs get resolved.
DllFunctionCall:
MSVBVM.dll uses DllFunctionCall to resolve the declare statements used to declare APIs. DllFunctionCall acts as the combination of LoadLibrary and GetProcAddress.
We take another VB program (P-Code), which executes a given file (simple msgbox in this case) using ShellExecuteA WinAPI, compiled it in P-code and we put BP on DllFunctionCall while we load that in debugger:

BP gets hit and DllFunctionCall calls shell32.dll
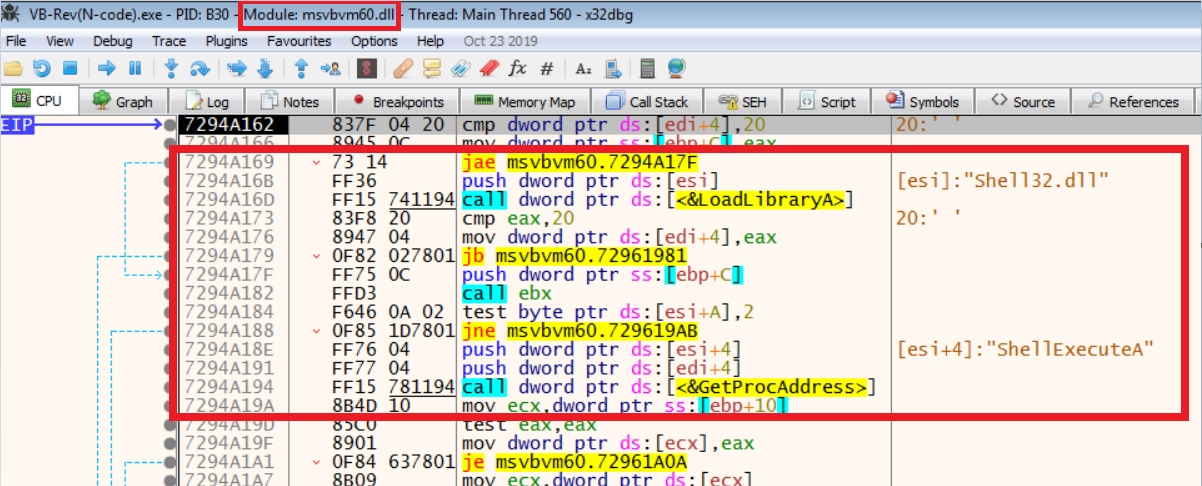
MSVBVM60.dll resolves ShellExecuteA from shell32.dll
To know what kind of WinAPIs are used in a VB exe, we use the OllyVB plugin (written by Waleedassar), which helps in finding the APIs used, as shown below:
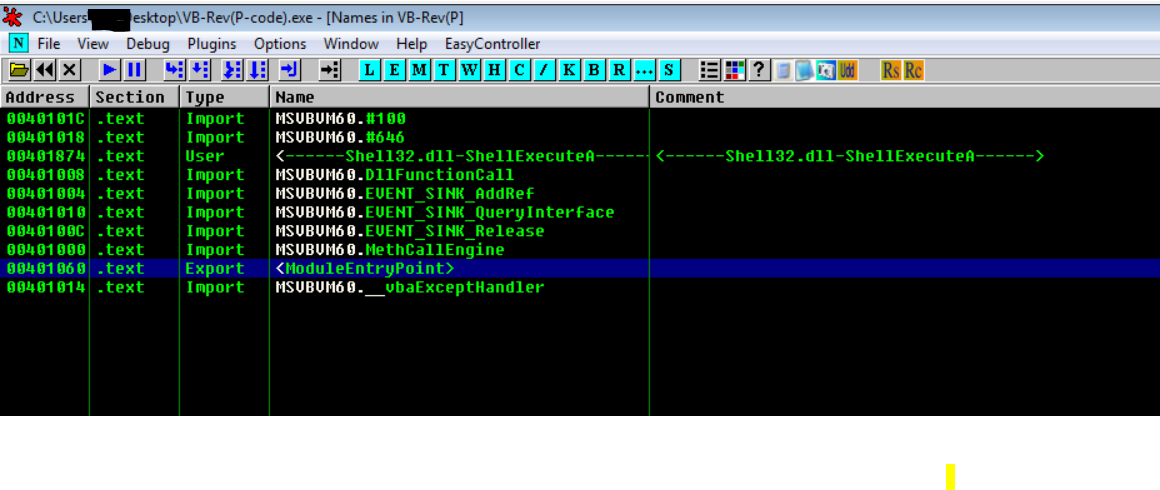
API visible after using OllyVB plugin
Note: Plugin usage is very simple, we just need to download and copy to the directory where ollydbg is installed. Then, plugins->ollyVB
We will now look into the analysis of a VB malware sample, which dynamically called DllFunctionCall to resolve the functions and how it resolved the DLLs. NetWireRAT (named on the basis of registry entry it creates for persistence), which was written in Visual Basic, is not new, but recently was seen being used for attacks in COVID themed malspams.
Analysis (NetWireRAT)
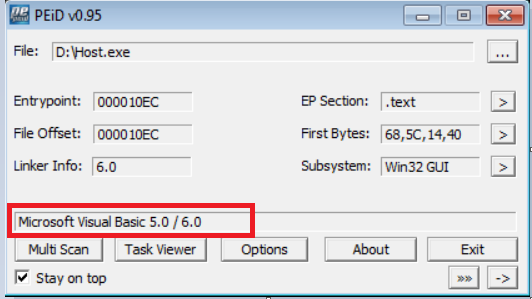
The file, as can be seen below, is not packed and has been compiled in Visual Basic:
Loading the malware into IDA:
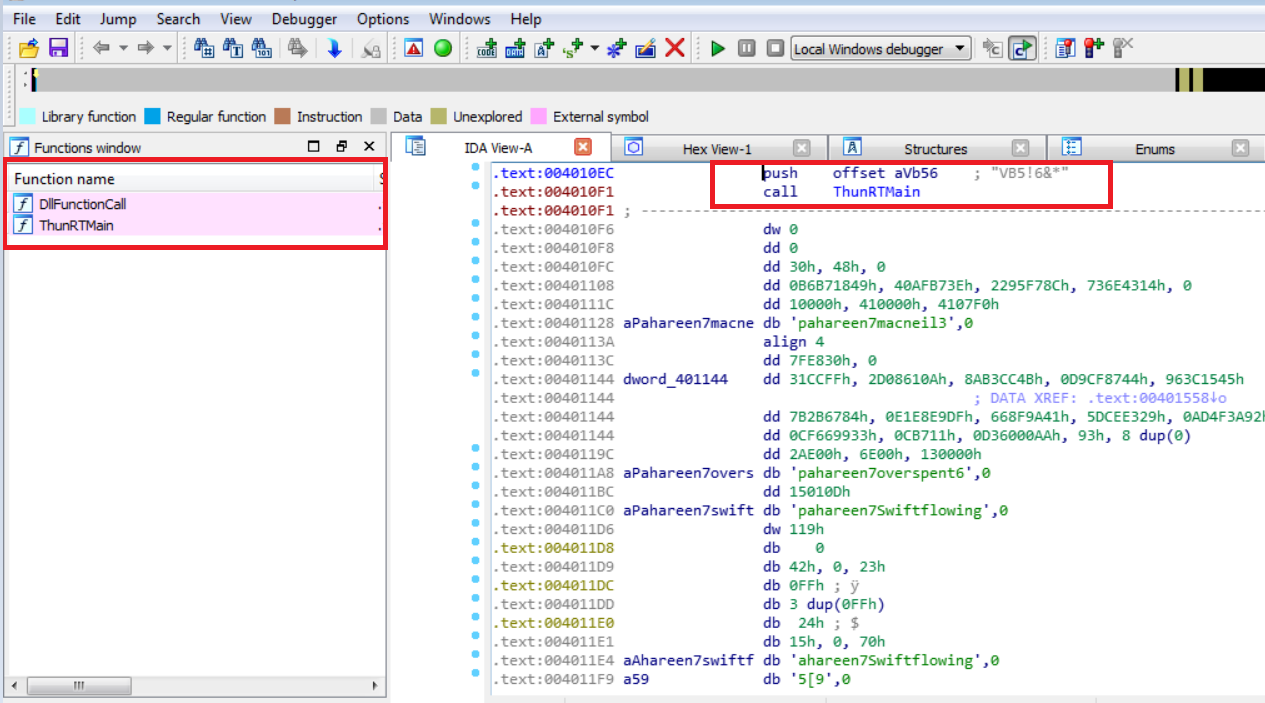
VB header and a call to ThunRtMain
Scrolling down a bit:
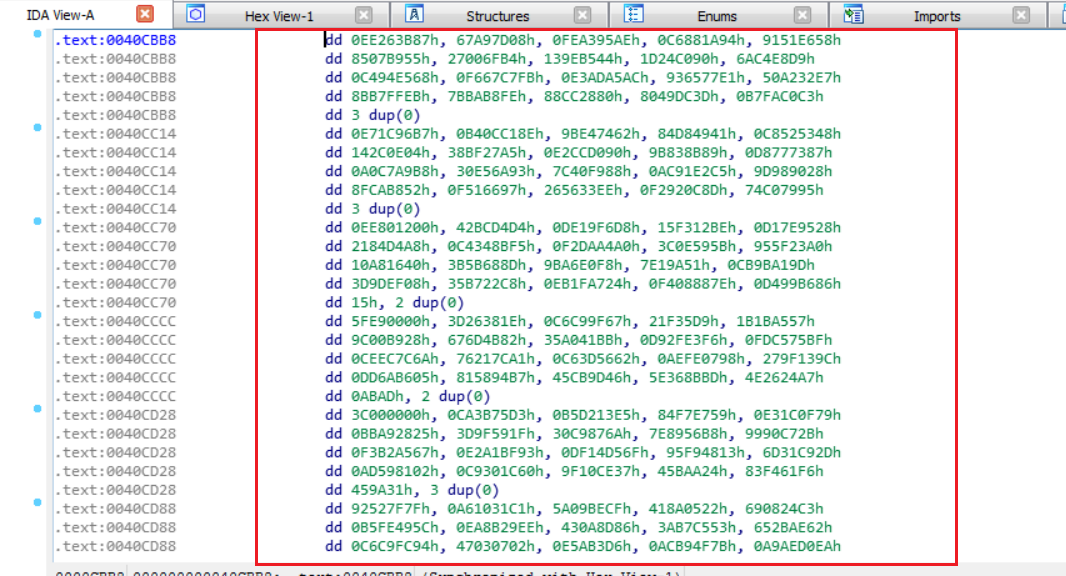
We can see in the above screenshots that analysing this VB malware in IDA would be a tedious task or we won’t get any hints other than its imports and moreover, it shows the intermediate code (visible in green) which is of no help to us while reversing.
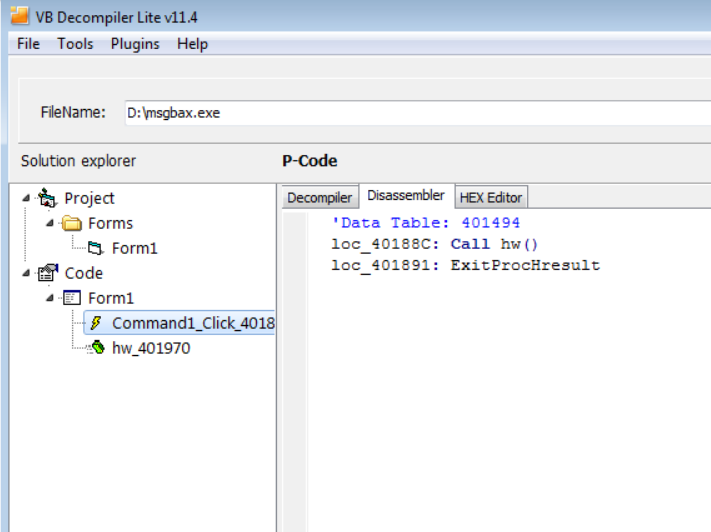
Let’s put this sample into VB-Decompiler tool:
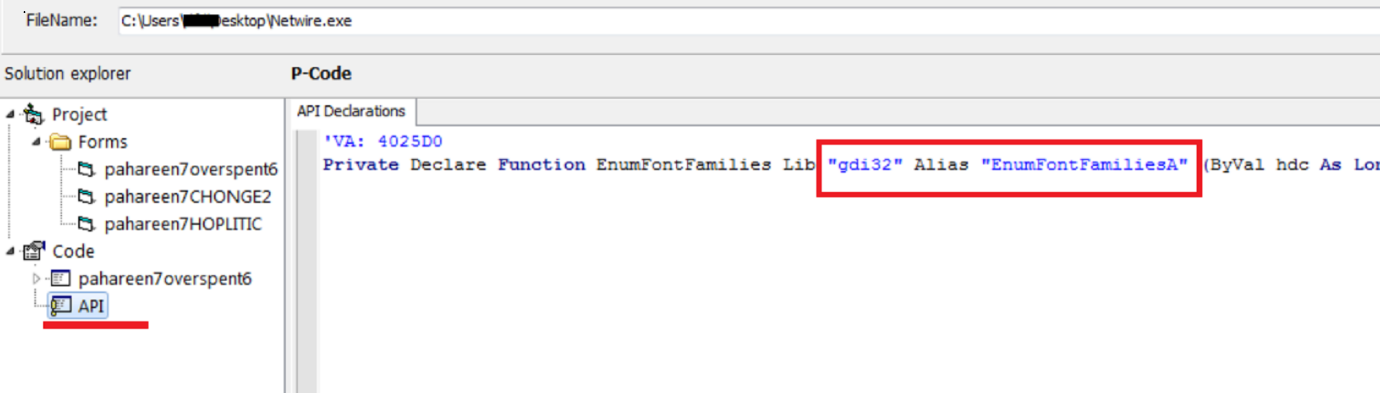
We have only one API visible and that’s even a graphics related API. Not much help!!!
So, we upload this sample in x64 debugger:
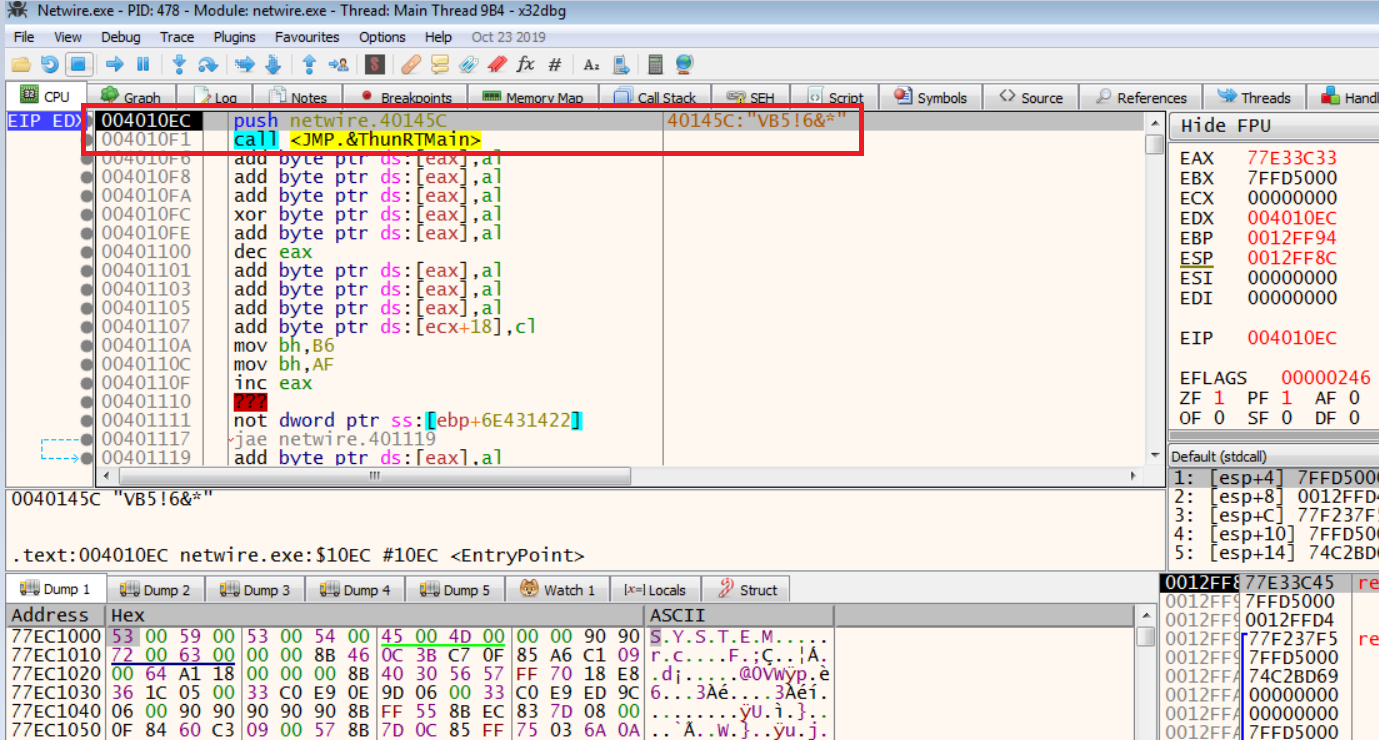
Entry Point
We follow the jmp instruction and we are at:

ThunRTMain (present in MSVBVMXX.dll) takes only one parameter, that is VBHeader structure, which contains fields required by Executable to get loaded in memory (discussed earlier).
Let’s check in the debugger how this malware sample is compiled, if it’s P or N code:
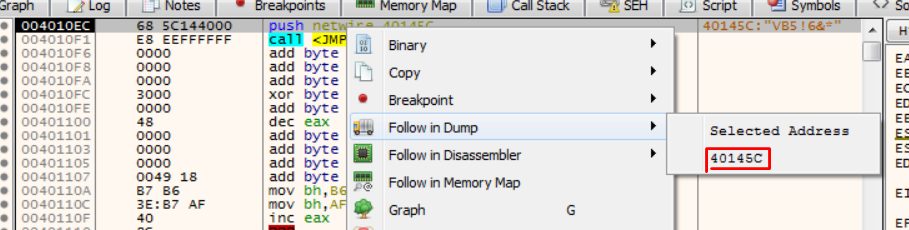
We right click on EP and follow the address as shown in dump, then:
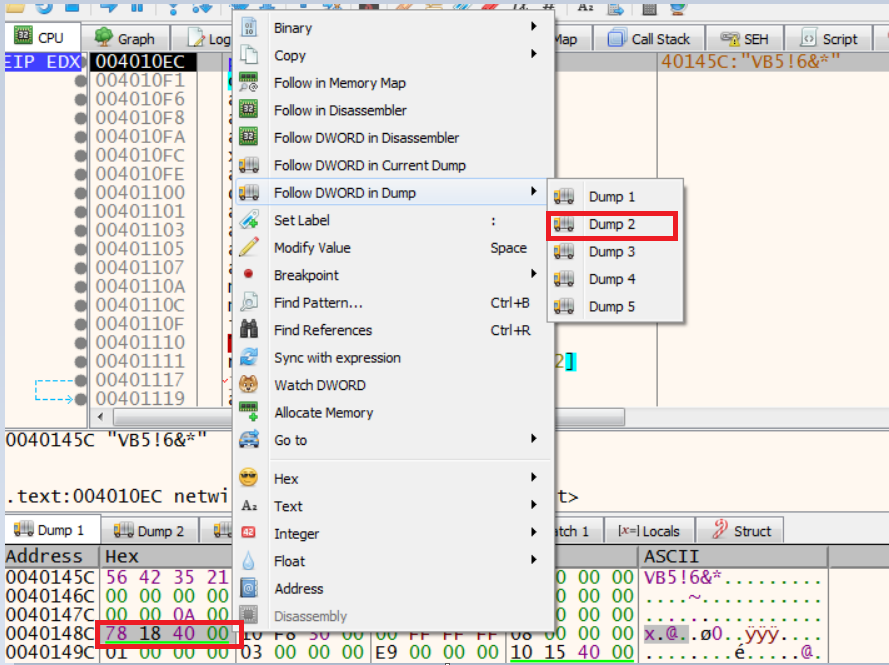
We now follow aProjectInfo structure in dump2, then:
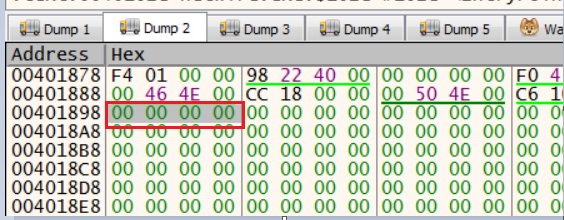
On checking aNative field in dump2, it’s all zero, which means the malware sample has been compiled in P-Code (pseudo code).
As discussed earlier DllFunctionCall, which is exported from MSVBVMXX.dll, is generally used to resolve WinAPIs in Visual Basic. DllFunctionCall basically works like LoadLibrary and GetProcAddress for resolving APIs. API function calls involve passing through all stubs and structures, which is why VB is believed to be quite slow.
Let’s put a break point on DllFunctionCall:

As shown above, once the BP is hit, we could see that there is only one DLL that is gdi32.dll that is generally used for graphics related stuff in the system (we saw this in VB-Decompiler earlier). On being run again, no other DLL was resolved using DllFunctionCall, that simply means the DLLs and APIs are getting resolved dynamically.
So, for that we put BP on EnumFontFamilies (the only API we saw above in the decompiler) and will proceed step-by-step.
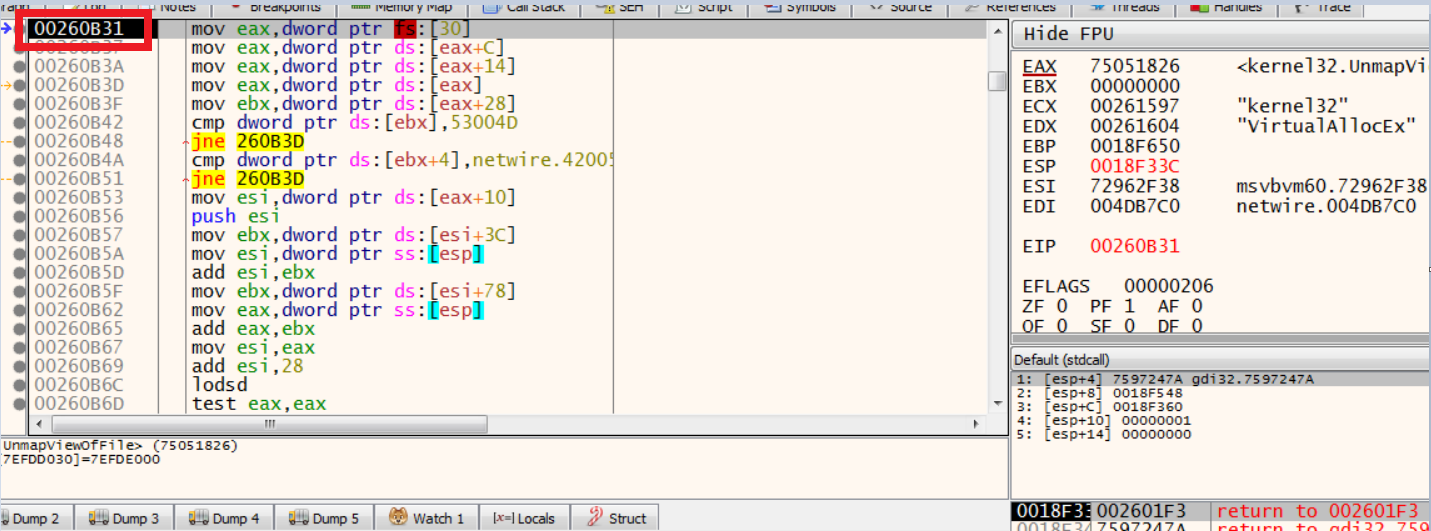
We found an interesting dynamic call; below is assembly code of one such function that gets called:
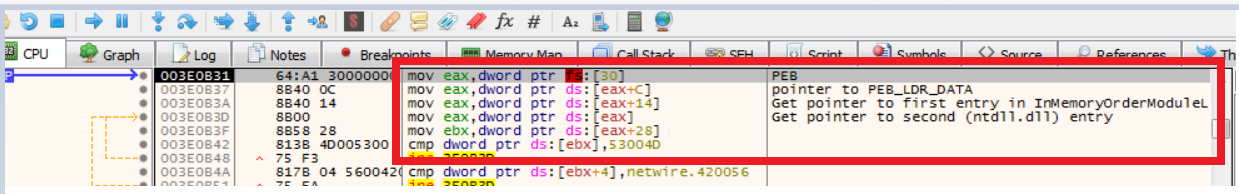
Using the above code, the malware first grabs PEB, i.e. Process Environment Block, and then it loads DLLs accordingly.
In short:
1.Using fs register (in 32-bit; in 64, it’s gs), malware finds PEB that is at location fs:[30h].
2. At 0x0C, _PEB_LDR_DATA structure is present. This structure contains info of the DLLs loaded.
3. Then we have the pointer to InMemoryOrderModuleList, which is simply the order list of DLLs loaded in memory.
4. After that we have our second entry that is ntdll.dll, then kernel32.dll and so on.
This way, the malware manually resolves the DLLs required.
Dynamic Forking
When this malware was tested in our lab, we found that it spawned another copy of itself in suspended mode through the use of NT APIs, which were resolved dynamically. The steps are shown below:
1.Creates the process with the same name as the file/process.
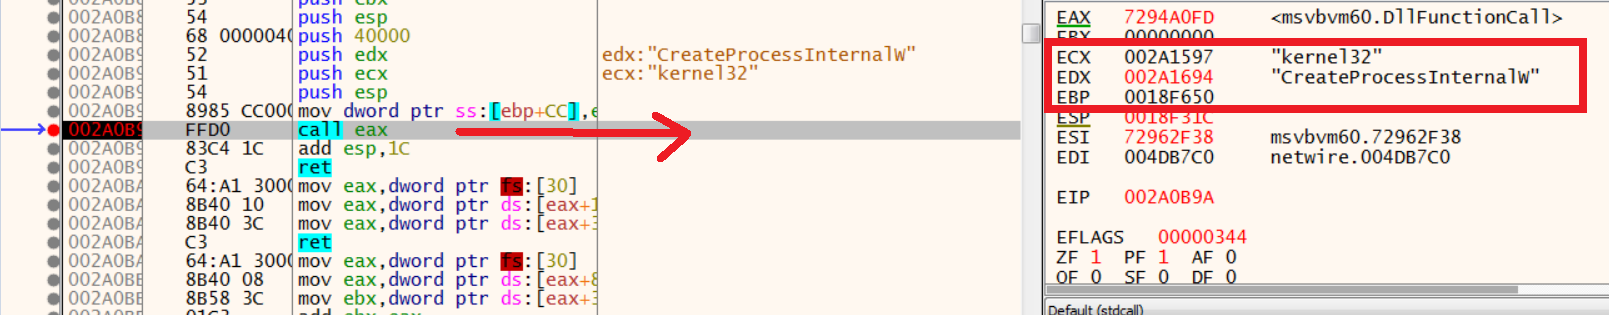
2.UnMaps it.
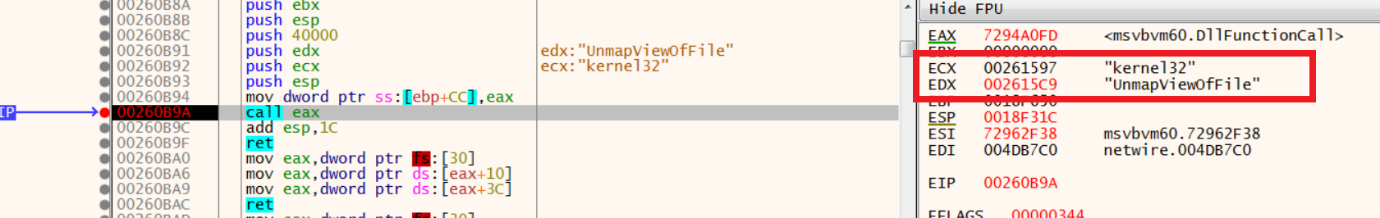
- From here, let’s dive into (step into) the above instruction to explore resolving of UnMapViewofFile API. Stepping into it, we found it uses DllFunctionCall (though the sample does not call this directly), which means it was dynamically resolved:
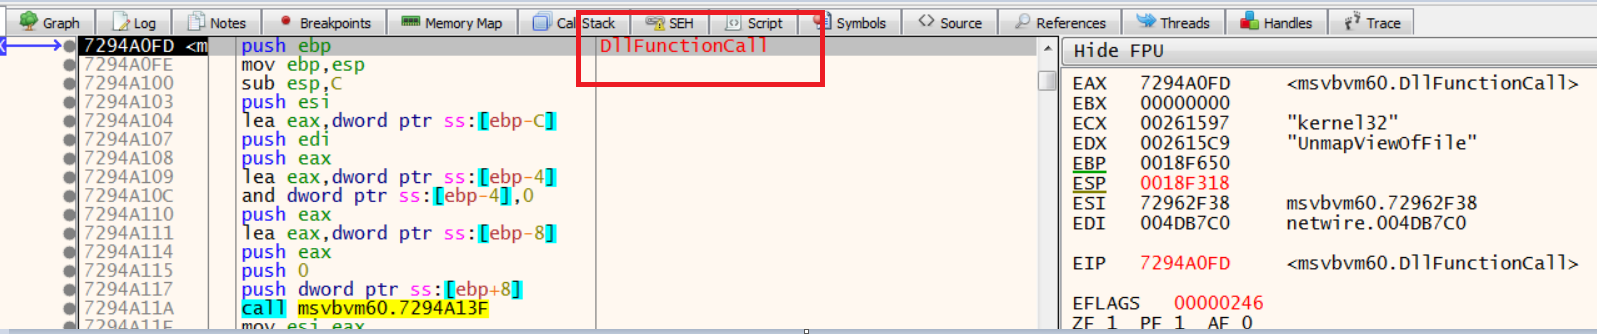
Call to DllFunctionCall
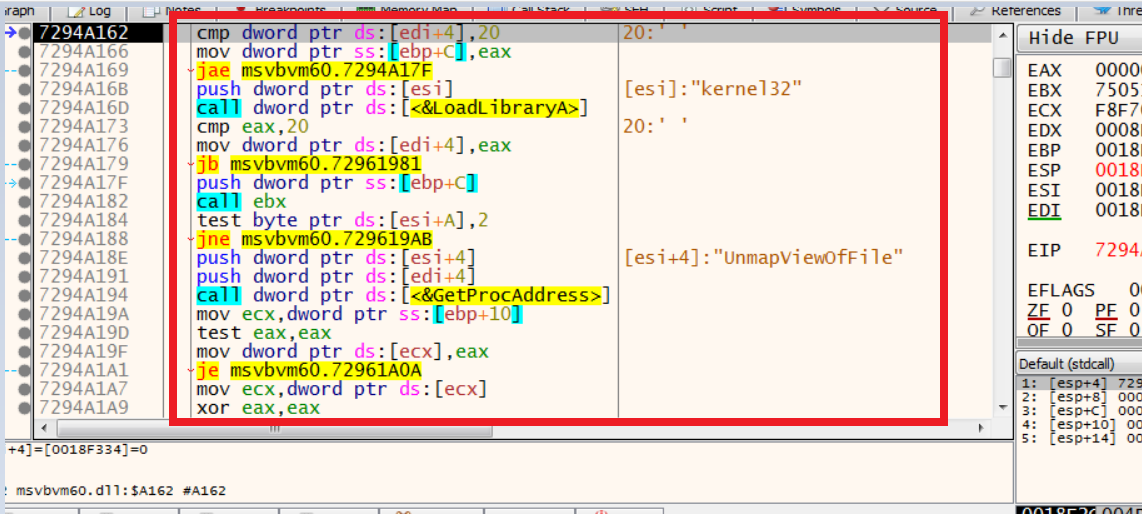
MSVBVM60.dll using GetProcAddress and LoadLibrary
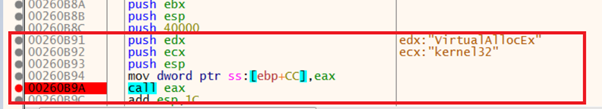
Now once the UnMapViewOfFile API gets resolved, the malware passed VirtualAllocEx as the next API as the argument to function 260B31 (in our case) to get that resolved dynamically:
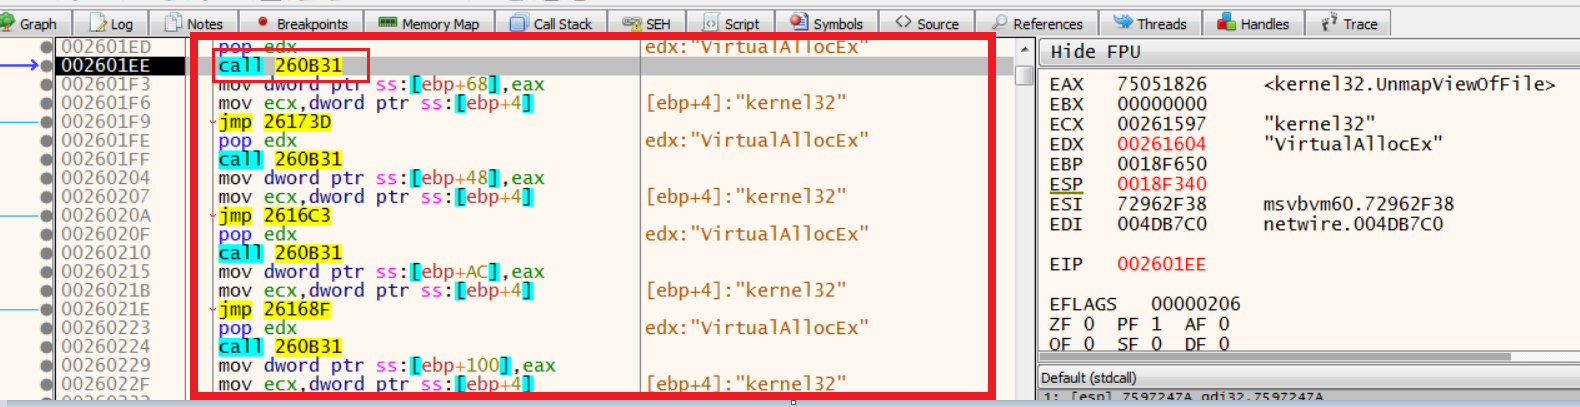
We step ahead and we are again in the same set of instructions that resolves the DLLs, this time it's kernel32.dll for VirtualAllocEx:
and then a call for resolving the VirtualAllocEx API:
Similarly, the below APIs get resolved by the malware dynamically using the same procedure above. The malware then,
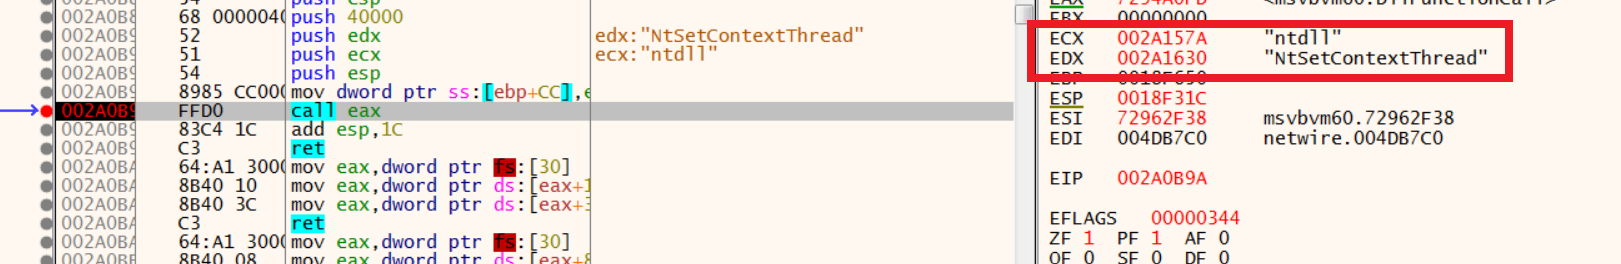
4.Reads the context of the registers (EAX,EBX,ECX,EIP, etc.).
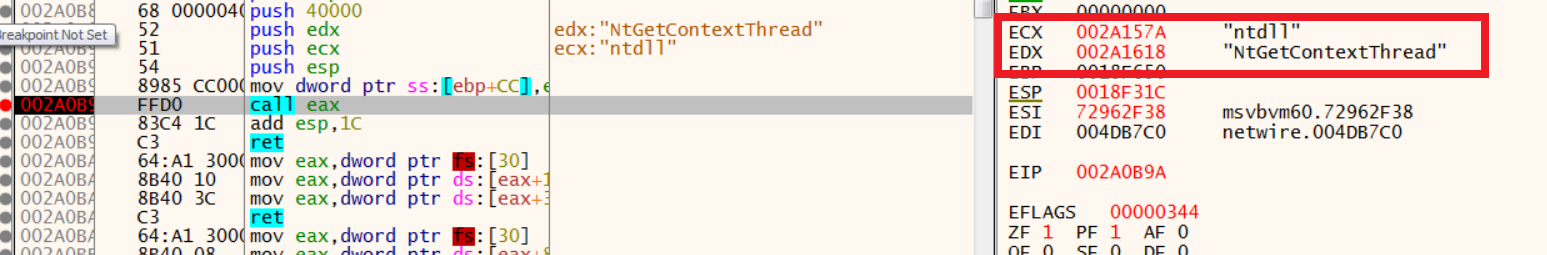
5.Sets the context of registers in the remote process.
6.At last as we can see, it resumes the execution of the suspended process after calling ResumeThread api:
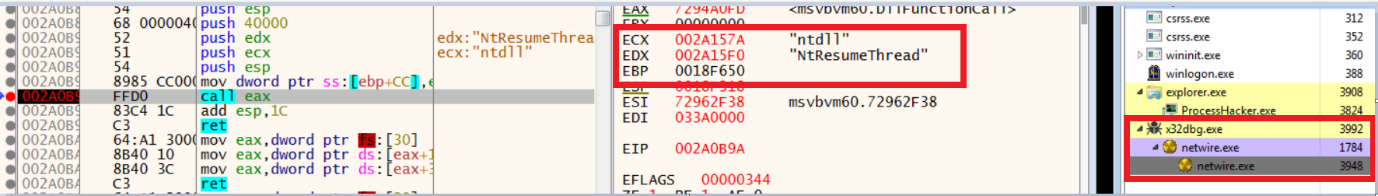
Note: VB packers generally use the above method, more specifically Process Hollowing to unpack further malware binaries, eg: Remcos RAT, Agent Tesla.
Kindly check references to get more insights on this Netwire malware sample.
Anti-Analysis Tricks
We also found some anti-analysis tricks being implied. The most common thing you would find in a VB malware is that it always has anti-analysis functionality, whether we take FormBook stealer, Remcos RAT, GuLoader, etc., all these samples had anti-analysis or anti-reversing tricks. In NetwireRAT and FormBook below were the anti-analysis tricks:
1.
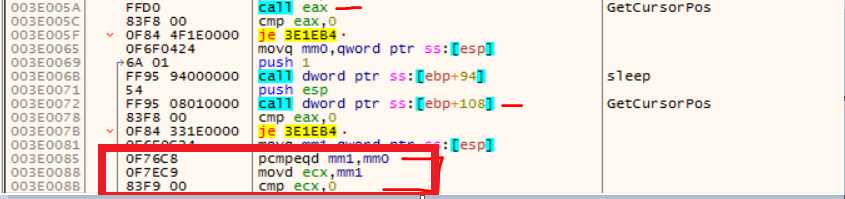
GetCursorPos API is generally used to retrieve the mouse coordinates on the system, so when the malware is running on the sandbox, it might use it as an anti-analysis trick in the way that malware calls the GetCursorPos APItwo times and compares them for a certain value. If they are same (mouse cursor not moving), then the environment might be a sandbox and the malware continues to run in a loop until the mouse cursor gets moved.
2.
Recently, FormBook stealer (VB compiled version) was also found to have a very interesting anti-analysis trick (though it’s an old trick), where while running it patched ntdll.DbgBreakPoint and ntdll.DbgUiRemoteBreakin. Generally, when we attach a debugger to a running process, the DebugActiveProcess API gets called, which then calls RtlCreateUserThread for creation of a new thread in target process with DbgUiRemoteBreakin as the starting point of the new thread. Malware hooks this and patches it in a way that this new thread exits as it gets started (or NOP). The screenshot below shows this patch:
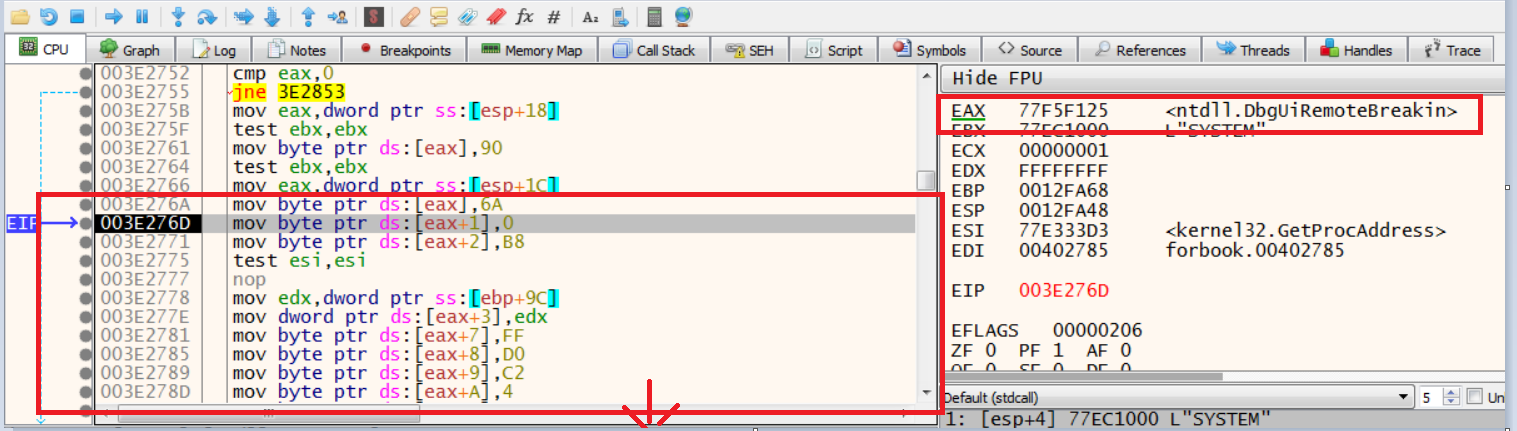
Patching Eax
Note:
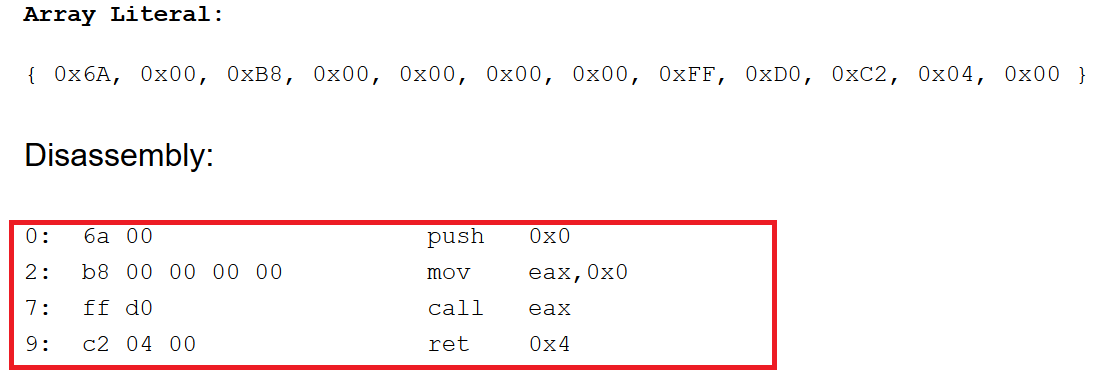
- Usually, while reversing VB malware, the instruction “call eax”, having an address corresponding to imagebase (0x4000000 If x86), is useful in determining the API call, as the return value gets stored in EAX register so APIs are called through the register.
- While you debug the malware sample written in VB, look for DllFunctionCall, as in some malware, it is directly called to resolve the WinAPIs, which saves a lot of time.
Conclusion
I am really thankful to my seniors Abhijit Mohanta and Anoop Saldanha for their continuous guidance and who provided helpful resources. I hope this article gives the reader ideas about how we can approach debugging the VB compiled (P-code) binaries or malware. In later articles, we will look into advanced static analysis of P-Code compiled VB binary using IDA, how the ProcCallEngine works, what are rtc prefixed calls, etcetera.
References and samples:
https://www.vb-decompiler.org/pcode_decompiling.htm
https://www.brainbell.com/tutors/Visual_Basic/Advanced_Optimizations.htm
https://en.wikipedia.org/wiki/Process_Environment_Block
https://www.fortinet.com/blog/threat-research/new-netwire-rat-variant-spread-by-phishing
More VB malware samples:
https://app.any.run/tasks/da07d70d-58a9-42a7-8074-d4697f659888/
https://app.any.run/tasks/c4375629-9420-4412-a037-c22e61c02a19/
https://app.any.run/tasks/4c654e7c-2912-4fd5-ba4c-01174f3224a5/
About Siddharth:
- Interested in cybersecurity, his blog: https://threatblogs.wordpress.com/
- Student currently pursuing bachelors of technology (Computer Science)
- Interested in malware analysis,reversing and forensics.
- Did internship at Computer Emergency Response Team, India (CERT-In)
The post Debugging VisualBasic Malware | By Siddharth Sharma appeared first on eForensics.